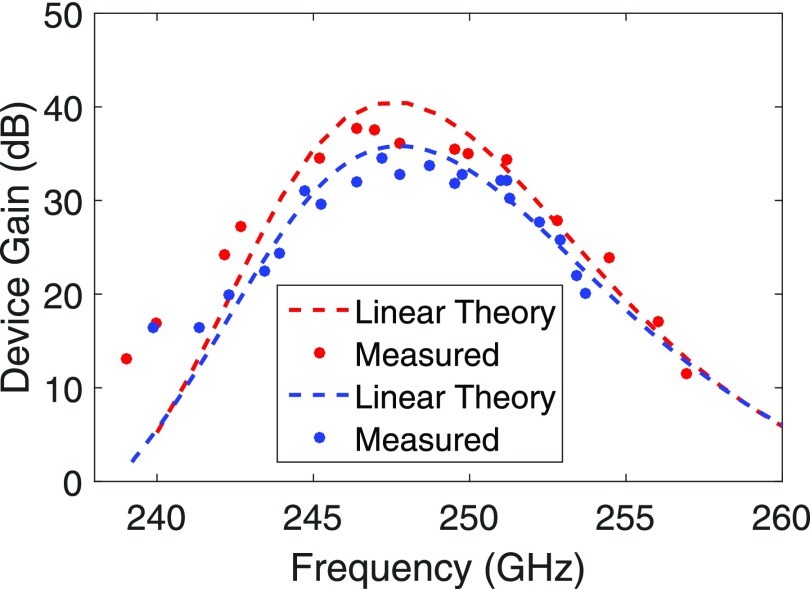
FIG. 2.
A comparison between the linear theory13 (dashed lines) including insertion losses14 and the measured (dots) gain-bandwidth of the amplifier. The red line and dots correspond to the nominal operating conditions of 22.8 kV, 675 mA, α = 0.45, and B0 = 8.90 T (Operating Point 1). A second operating point is shown with a blue line and dots for 25.2 kV, 511 mA, α = 0.5, and B0 = 8.90 T (Operating Point 2).

