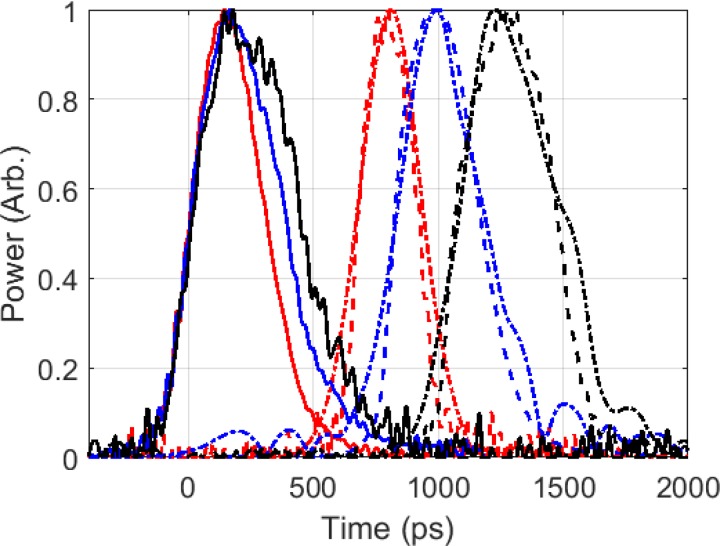
FIG. 6.
Input and output pulses measured with a variety of input pulse widths at a center frequency of 249.7 GHz. Pulse compression is observed when the bandwidth of the amplified pulse is increased due to the gain-bandwidth for the parameters in Fig. 2 for Operating Point 2. The traces with solid lines (–) are for measured input pulses, the dashed lines (- -) are for measured output pulses, and the dash-dotted lines (-) are for the modeled output pulse using the input pulse waveform. For the red traces, the measured input pulse width was 320 ps with a measured/modeled output pulse width of 260/285 ps; for the blue traces, the measured input pulse width was 380 ps with a measured/modeled output pulse width of 360/380 ps; and for the black traces, the measured input pulse width was 440 ps with a measured/modeled output pulse width of 425/460 ps.

