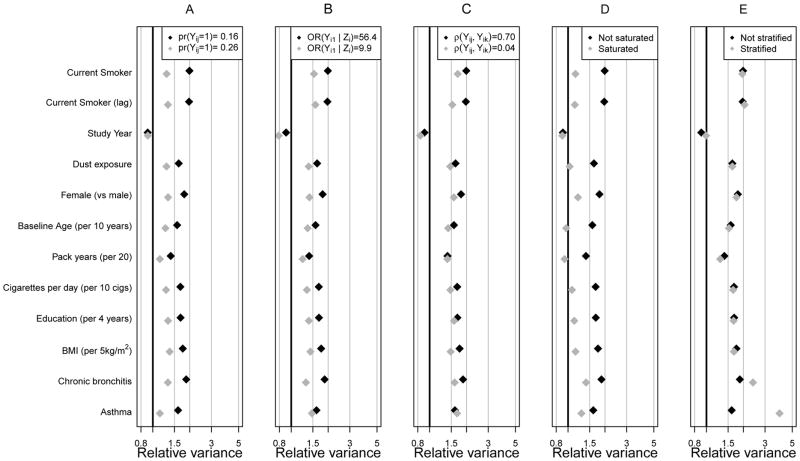
Figure 2.
Relative Variance across 250 replicates as a function of data features for the severe chronic obstructive pulmonary disease outcome: We show for a number of data features. Black diamonds denote the analyses presented in Table 3 and grey diamonds show the result of perturbing one data, analysis or design feature. Panels show the impact on relative variance of response prevalence (A), strength of the Z ~ Y relationship (B), amount of response dependence (C), richness of the auxiliary variable model for Z (D), and asthma exposure and auxiliary variable sampling (E).

