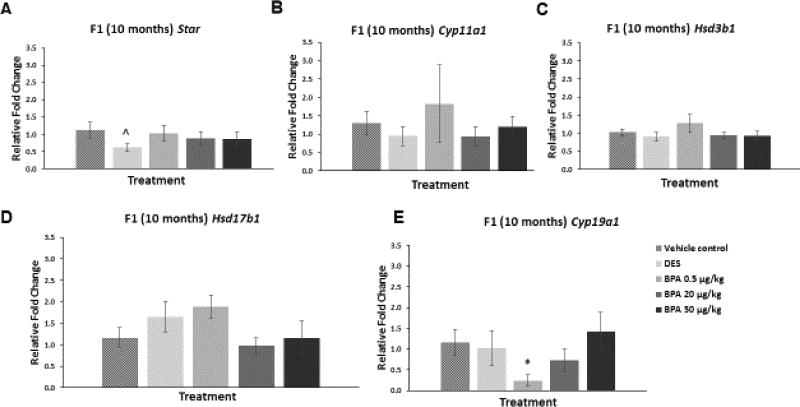
Figure 5. Effect of BPA and DES on Steroidogenic Enzyme mRNA Levels in the F1 generation (10 months).
Ovaries were collected from the F1 generation of mice at 10 months of age, and then subjected to quantitative polymerase chain reaction for Star (panel A), Cyp11a1 (panel B), Hsd3b1 (panel C), Hsd17b1 (panel D), and Cyp19a1 (panel E). The graph represents the means ± SEM (n = 3–7 ovaries/treatment) of relative fold changes normalized to Actb. Asterisk (*) represents statistically significant difference from the vehicle control (p ≤ 0.05). ^ indicates p = 0.09.

