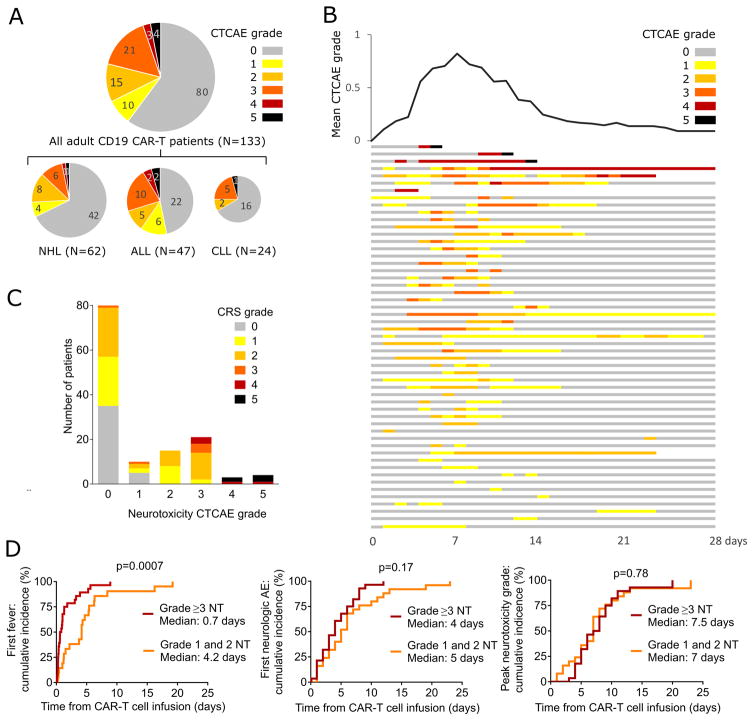
Figure 1. Frequency, kinetics, and treatment of neurotoxicity.
A: The numbers of patients with each overall neurotoxicity grade are shown for the entire cohort and each disease. The diameters of each pie chart indicate the relative size of each subgroup. B: The swimmer plot (bottom) shows the kinetics of the severity of neurotoxicity in each patient who developed neurotoxicity through 28 days after CAR-T cell infusion (n=53). Each row represents one patient and the colors indicate the highest grade of neurotoxicity recorded on each day. Six patients died within 28 days of CAR-T cell infusion (neurotoxicity, n=3; disease progression, n=1; CRS, n=2). The graph (top) shows the mean of the highest grade of neurotoxicity occurring in all patients on each day after CAR T cell infusion. C: Numbers of patients with each grade of neurotoxicity and CRS. D: Cumulative incidences of fever, any grade of neurotoxicity, and the peak grade of neurotoxicity are shown for patients with grade 1–2 and grade ≥3 neurotoxicity.

