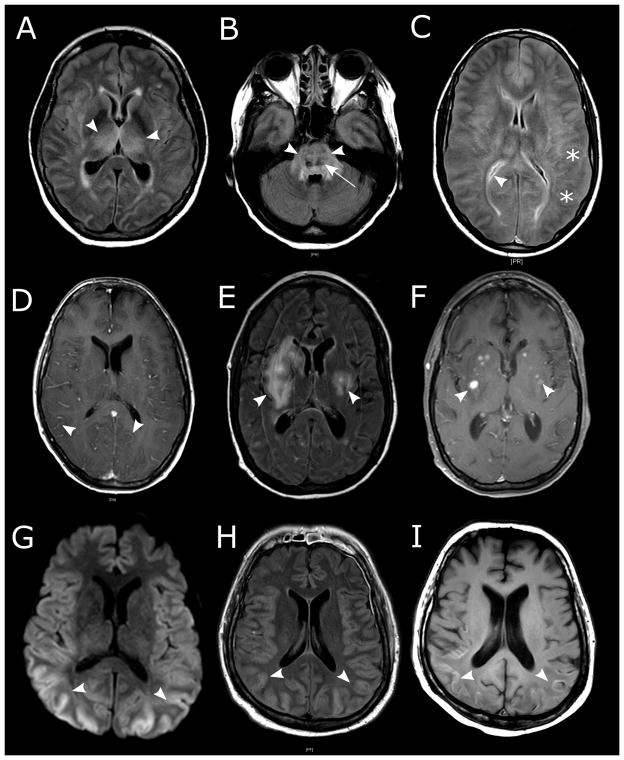
Figure 2. Brain magnetic resonance imaging (MRI) findings in patients with severe neurotoxicity after CD19 CAR-T cell immunotherapy.
A–B: Symmetric edema of deep structures in a patient with grade 5 neurotoxicity. FLAIR hyperintensities were seen in the bilateral thalami (A, arrowheads) and the pons (B, arrowheads), consistent with vasogenic edema. Punctate hemorrhages in the most affected areas are seen as T2 dark lesions (B, arrow). C: Global edema with blurring of the gray-white junction (stars) and slit-like ventricles (arrowhead) on FLAIR imaging in a patient with grade 5 neurotoxicity. D: Diffuse leptomeningeal enhancement (arrowheads) in a patient with grade 5 neurotoxicity. E–F: White matter FLAIR hyperintensities (E, arrowheads) that in some cases were contrast enhancing (F, arrowheads; T1 + gadolinium) in a patient with grade 3 neurotoxicity without focal neurologic deficits on exam. G–I: Cytotoxic edema of the cortical ribbon is seen on diffusion weighted imaging (G, arrowheads) and concomitant cortical swelling on FLAIR (H, arrowheads). In the same patient, injury progressed to irreversible cortical laminar necrosis indicated by T1 hyperintensities within the cortical ribbon 10 days later (I, arrowheads).

