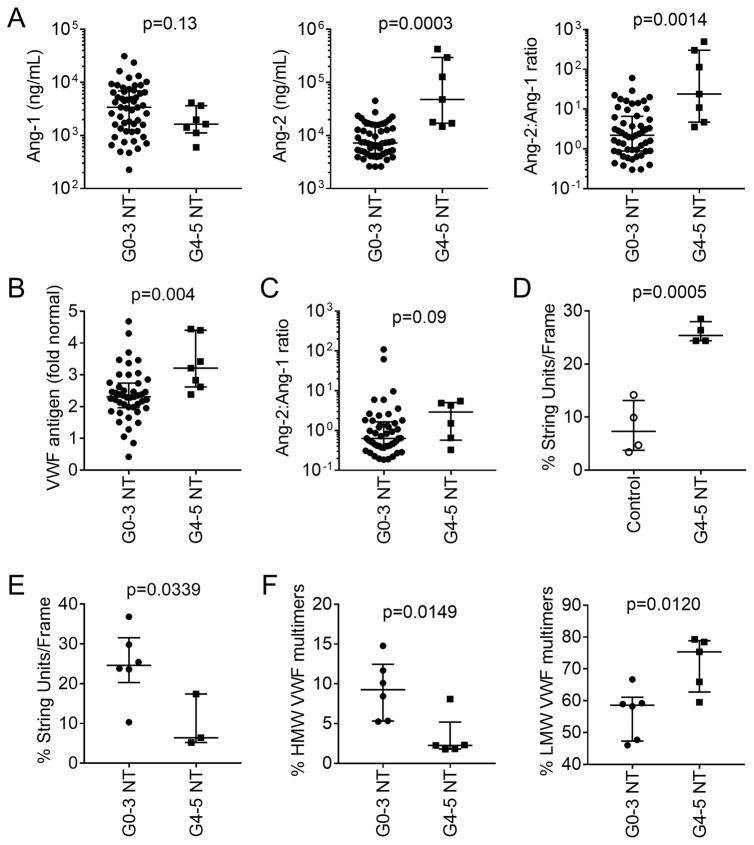
Figure 4. Endothelial activation in neurotoxicity associated with CD19 CAR-T cell immunotherapy.
A: Ang-1 (left) and Ang-2 (center) concentrations and the Ang-2:Ang-1 ratio (right) in serum collected approximately 7 days after CAR-T cell infusion from a subset of patients with grade 0–3 (n=52) or ≥4 (n=7) neurotoxicity. The median (bar) and interquartile range are shown. Each point represents data from one patient. B: VWF concentration in serum from patients with grade 0–3 (n=45) or grade ≥4 (n=7) neurotoxicity. Serum was collected approximately one week after CAR-T cell infusion. Data represent the fold change from the VWF concentration in normal reference plasma (CRYOcheck, Precision Biologic, Dartmouth, NS, Canada; VWF 12.2 μg/mL). C: Ang-2:Ang-1 ratios in serum collected before lymphodepletion chemotherapy from patients who subsequently developed grade 0–3 (n=49) or ≥4 (n=6) neurotoxicity. The median and interquartile range are shown. D: VWF string unit formation in HUVECs incubated with serum collected from day 3–5 from patients who received CD19 CAR-T cells and developed grade ≥4 neurotoxicity (n=4) or from healthy donors (n=4). E: VWF string unit formation in HUVECs incubated with serum collected from patients with grade ≥4 (n=3) or grade 0–3 (n=6) neurotoxicity between day 7 and 14 after CAR-T cell infusion. The mean value of 2 samples collected on days 7 and 10 was used for one patient without neurotoxicity. F: HMW and LMW VWF multimers in serum from patients with grade ≥4 (n=5) compared to grade 0–3 (n=6) neurotoxicity.

