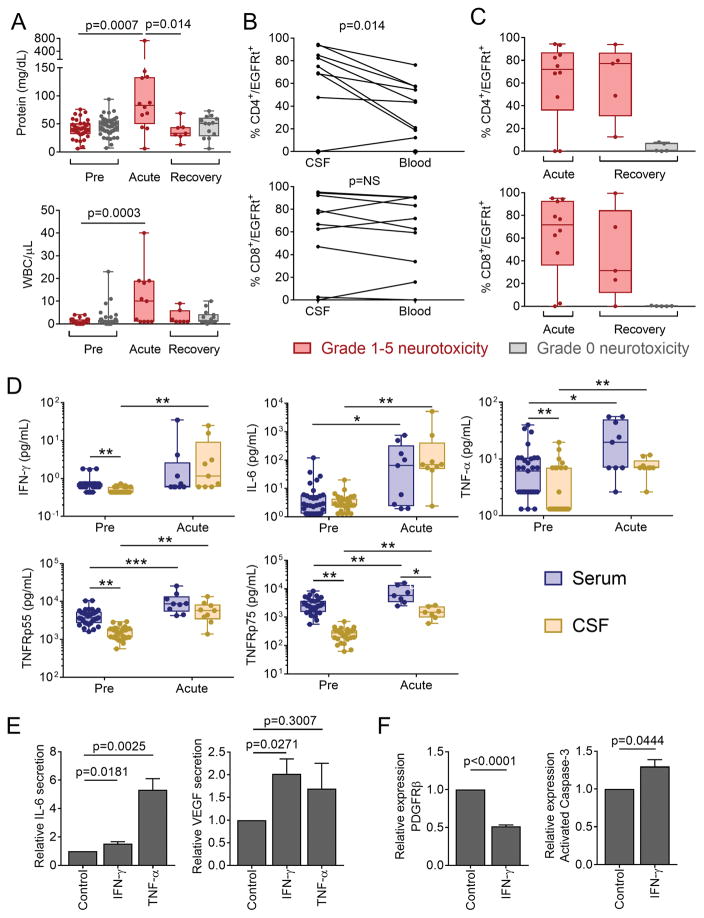
Figure 5. Increased permeability of the BBB during neurotoxicity.
CSF was collected from patients before CAR-T cell infusion (Pre), during acute neurotoxicity (Acute), and after recovery from acute neurotoxicity or ≥21 days after CAR-T cell infusion in those without neurotoxicity (Recovery). A: Protein concentration and WBC counts in CSF in patients who did (red) or did not (grey) develop neurotoxicity. Each point represents data from a single patient. Box and whisker plots show the interquartile range. B: Paired CSF and blood samples collected on the same day from individual patients with neurotoxicity, showing CD4+ and CD8+ CAR-T cells as a percentage of total CD4+ and CD8+ cells, respectively. Each line represents data from a single patient. NS, not significant. C: CD4+ and CD8+ CAR-T cells as percentages of total CD4+ and CD8+ cells, respectively, in CSF. Each point represents data from a single patient. Box and whisker plots show the interquartile range. D: Concentrations of cytokines in paired serum and CSF samples obtained from patients who developed neurotoxicity. Box and whisker plots show the median (bar) and interquartile range (box). Each point represents data from one patient. *p<0.05, **p<0.01, ***p<0.001. Paired tests were used to compare serum and CSF cytokines at a single timepoint. Unpaired tests were used for comparisons between Pre and Acute timepoints. E: IL-6 and VEGF concentrations in supernatant from pericytes cultured with medium alone, IFN-γ or TNF-α. Data are representative of 6 experiments and are expressed as the fold change (mean +/− SEM) compared to culture in medium alone. F: PDGFRβ and activated caspase-3 expression by human brain vascular pericytes incubated with IFN-γ. Data are expressed as the fold change (mean +/− SEM) compared to culture in medium alone.

