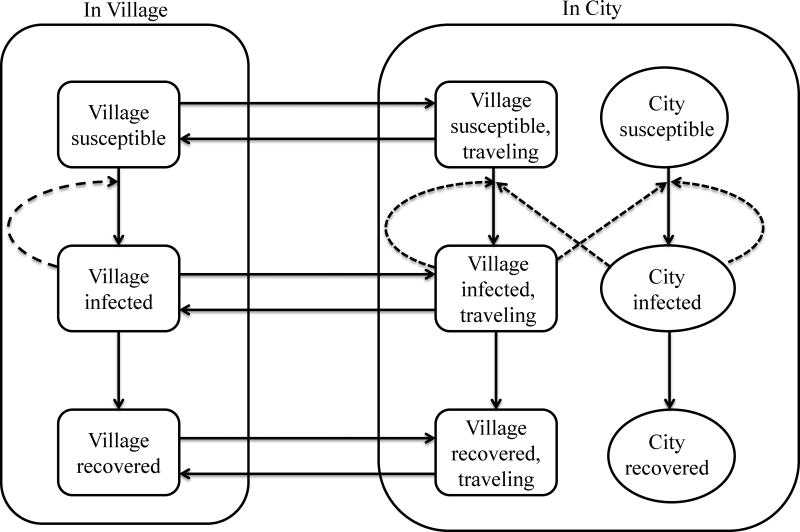
Figure 1.
Rotavirus transmission model diagram. Dashed arrows represent transmission events and solid arrows represent movement of people. Villagers and city residents are classified as susceptible (S), infected (I) and Recovered (R), with separate compartments for individuals under age 5 and ages 5 and older (not shown). Susceptible people can become infected by direct transmission within their own community. Villagers can infect and be infected by the city during travel. We ignore travel by city dwellers and between smaller villages. Village susceptible infectious recovered (SIR) model is stratified by baseline remoteness (close, medium and far) and both village and city SIR models are stratified by year (2004, 2007, 2010, and 2013) resulting in 12 models. Each model is stratified by age (less than or greater than 5 yrs.). This stratification results in 8 transmission parameters (6 village-level due to 2 age-groups and three community groups, and 2 city level due to two age groups), and 24 travel rate parameters to and from the city (2 age groups, 4 years, and 3 community types, where). Population size also varies by age, community type, and year. The recovery rate parameter is the same for all SIR models. See eAppendix for model equations and details.

