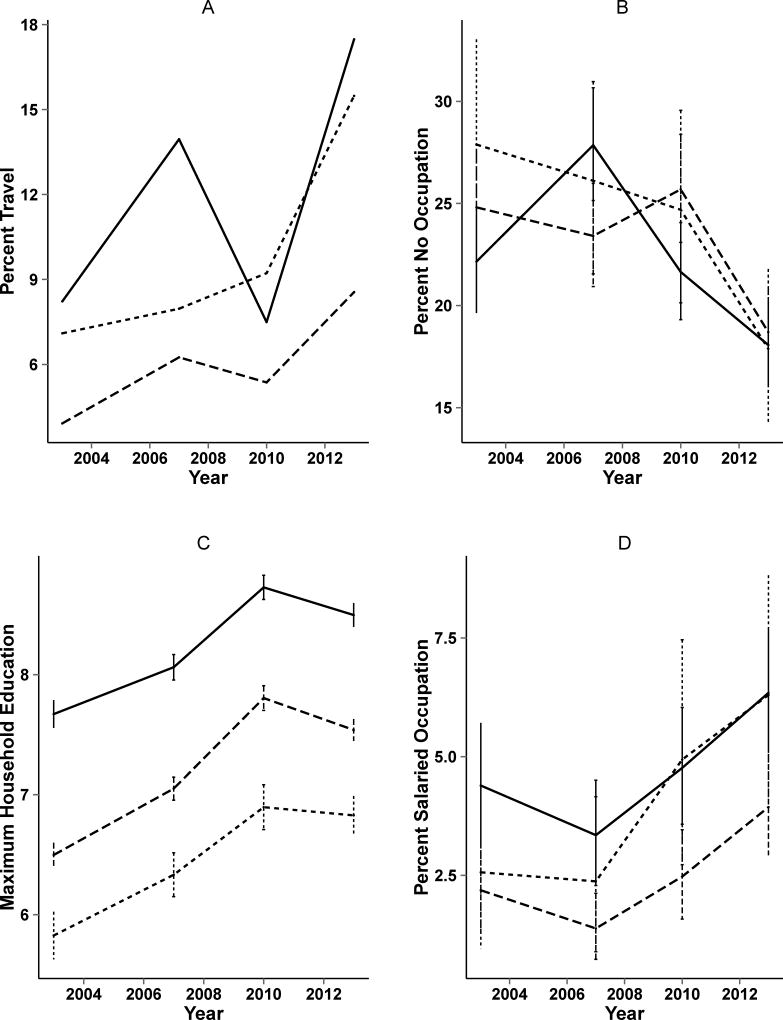
Figure 2.
Demographic changes over time by study year and remoteness strata from the survey data. Close, medium, and far villages are shown as solid line, small dashed line, and longer dashed line respectively. A) Percent out-of-region travel (weighted by population size), B) Percent reporting no occupation, C) Maximum household education (years), D) Percent reporting salaried occupation.

