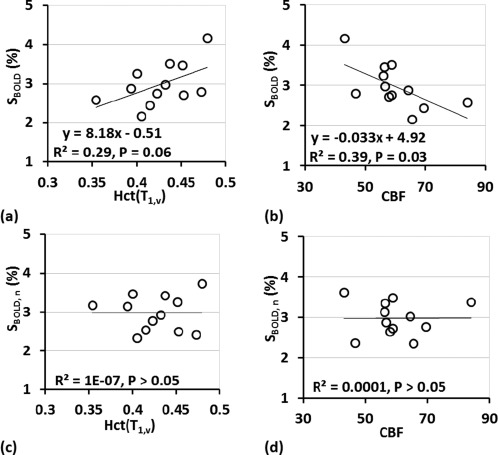
Figure 3.

Scatter plots of BOLD signal change (S BOLD) with (a) Hct(T 1,v) and (b) CBF. S BOLD were positively correlated with (a) Hct (P = 0.06) and negatively correlated with (b) CBF (P = 0.03). (c,d) Scatter plots of normalized BOLD signal change (S BOLD, n) after removing the variance explained by each effect [Eq. (4)].
