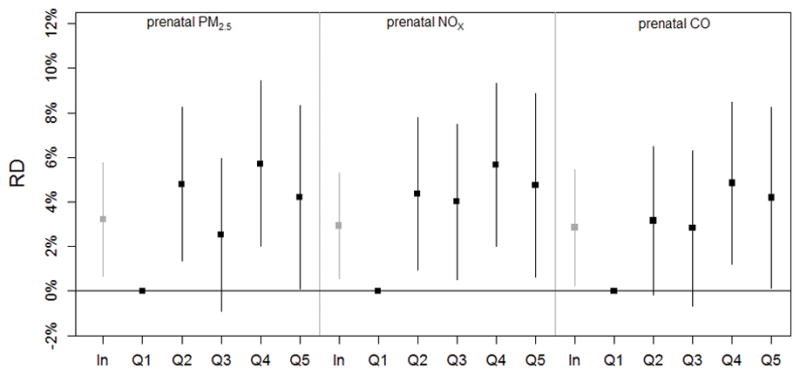
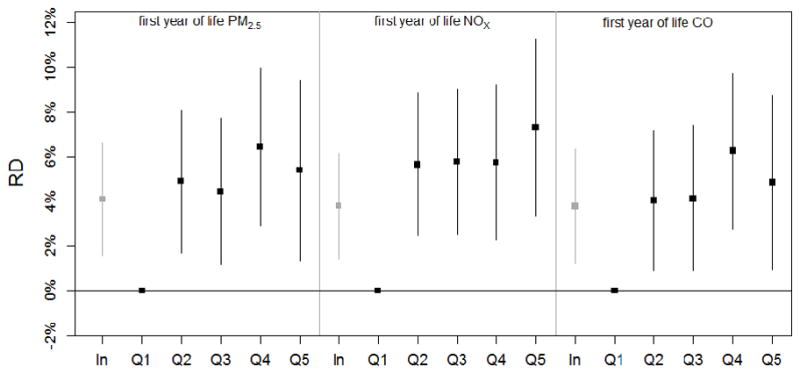
Figure 3.


Adjusted risk differences and 95% confidence intervals for incident asthma by age 5 and prenatal (n=7,520) and first year of life (n=8,591) mobile source PM2.5, NOX, and CO: per natural log increase and by quintile (Q1–Q5). Numeric results corresponding to this figure are listed in Table 2, eTable 1, and eTable 3.
