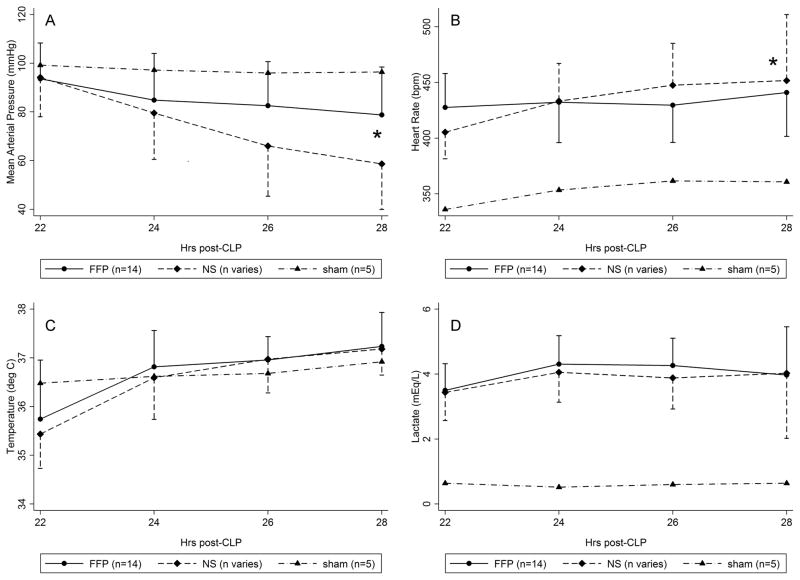
Figure 3A–D.
Intra-resuscitation vital signs and lactate level. Curves for sham animals provided for reference, and error bars for sham animals were omitted for clarity. The FFP curves summarize data for all animals (n=14/14). The NS curves summarize data for 14/14 animals at t=22h, 13/14 animals at t=24h, and 11/14 animals at t=26 to 28h due to animal death during resuscitation. FFP animals had significantly higher MAP (A) and lower heart rate (B) than NS animals, but the temperature (C) and lactate (D) curves were not statistically different. *, p<0.05 for time by treatment interaction on ANOVA with repeated measures of FFP vs NS. NS, normal saline; FFP, fresh frozen plasma; ANOVA, analysis of variance.

