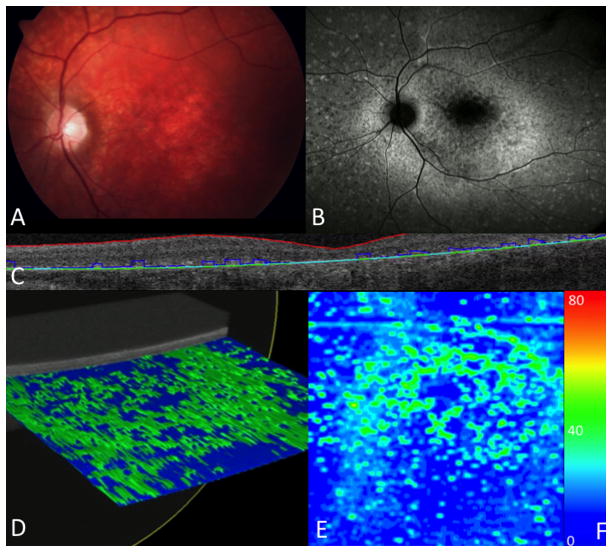
Figure 3.
Ellipsoid zone and photoreceptor outer segment mapping in a patient with severe attenuation. (A) Fundus photograph with macular changes. (B) Fundus auto-fluorescence showing macular atrophy. (C) Ellipsoid zone and photoreceptor outer segment segmentation of B scan. (D) Reconstruction of a three dimensional macular cube with severe loss. (E) En face map with larger central areas of loss (blue), with small areas of normal (green). (F) Color scale depicting the thickness range (in microns) visualized on an en face map, from atrophy (0 microns, dark blue) to 80 microns (red). Normal ellipsoid zone and photoreceptor and outer segment thickness (40 microns) is green.

