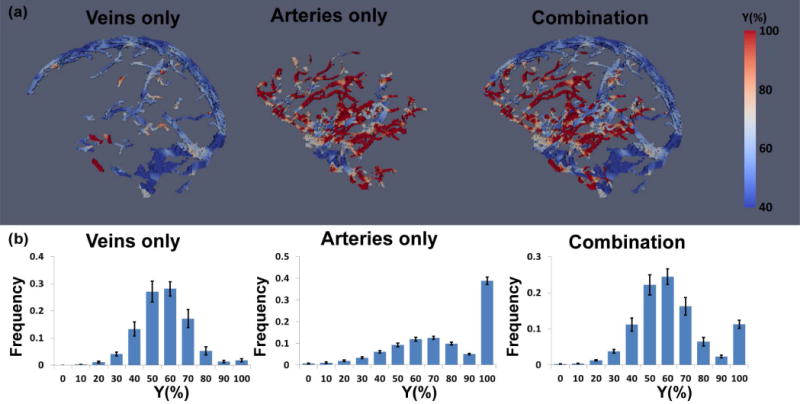
Figure 5.

Quantitative oxygenation maps obtained from TRU-PC 3D. (a) An example of 3D oxygenation maps of veins only, arteries only, and their combination. (b) Histogram of oxygenation values in each map. The results of all participants were averaged, with error bars indicating standard errors across individuals.
