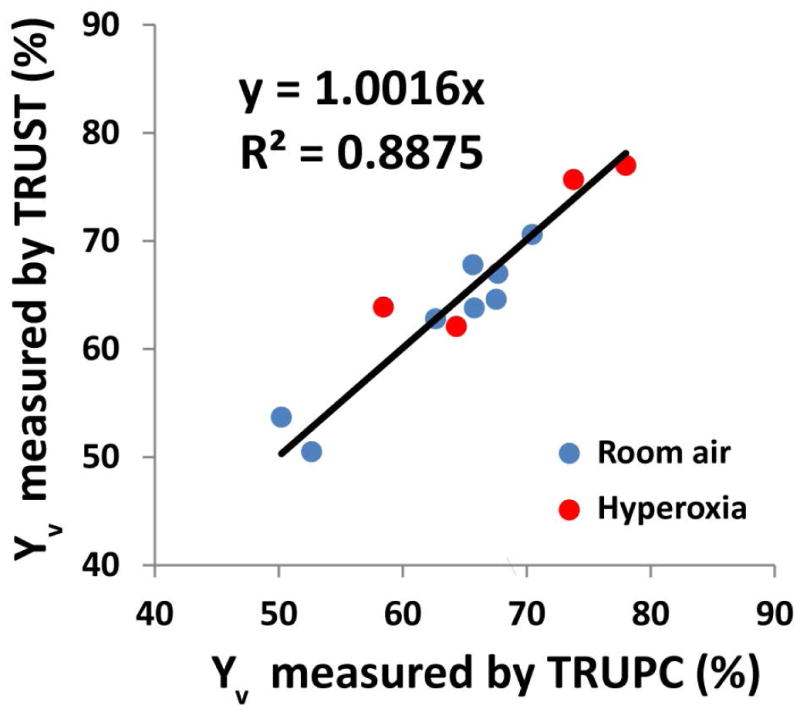
Figure 7.

Scatter plot between oxygenation values measured with TRU-PC 3D and those from TRUST MRI. Blue dots represent results under room-air breathing. Red dots represent results under hyperoxia. Four subjects participated in both room-air and hyperoxia experiments. Four additional subjects participated in room-air only.
