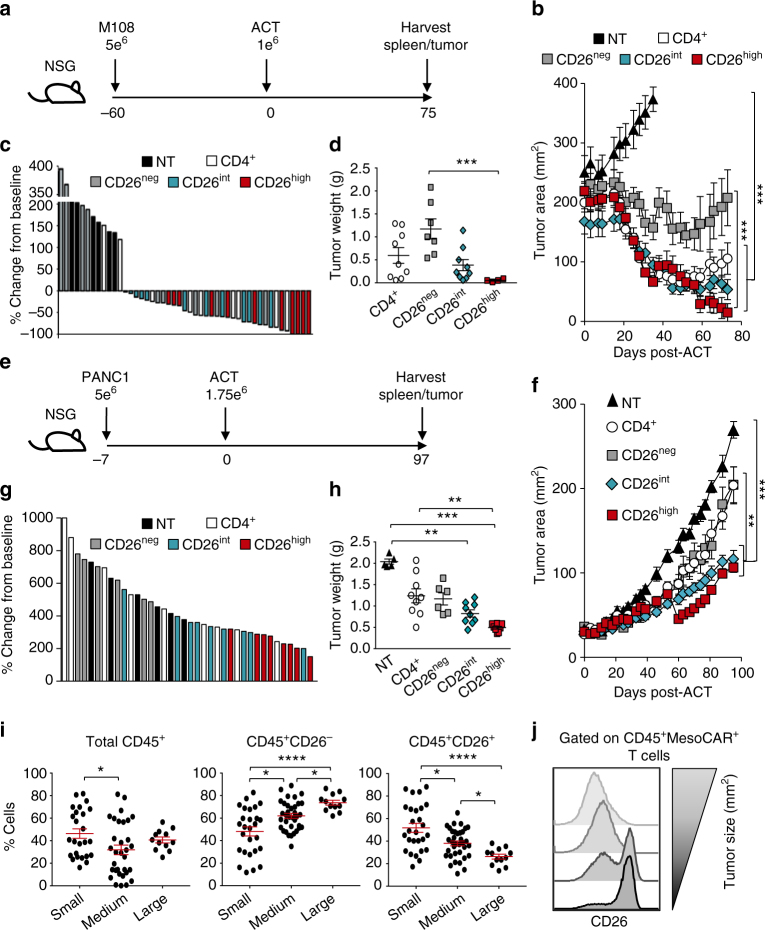
Fig. 5.
Human CD26int and CD26high T cells regress/slow established tumors. CD4+ T cells were isolated from healthy individuals, sorted by CD26 expression, transduced to express MesoCAR, and expanded for 10 days. a, b NSG mice bearing large M108 mesothelioma tumor (established for 60 days) were infused with 1e6 human CD4+, CD26neg, CD26int, or CD26high T cells. Post-ACT, tumors were measured bi-weekly until mice were killed and organs harvested at 75 days post-ACT (N = 7–9 mice per group). P values for the tumor curve were calculated by one-way ANOVA with a Kruskal-Wallis comparison on the final day when mice from all comparison groups were still alive (NT vs. all groups = day 38; CD26neg vs. CD26high = day 59). c Percent change in tumor size from baseline (day 0) to endpoint (day 75) was calculated and graphed as a Waterfall plot. d Graphical representation of tumor weights (g) harvested from treated mice 75 days post-ACT. e, f NSG mice bearing established pancreatic tumors (PANC1) were infused with 1.75e6 human CD4+, CD26neg, CD26int, and CD26high T cells and tumors were measured bi-weekly for more than 3 months (N = 6–9 mice per group). P values for the tumor curve were calculated by one-way ANOVA with a Kruskal-Wallis comparison on the final day when mice from all comparison groups were still alive (All groups = day 84). g Graphical representation of tumor weight (g) harvested from mice 97 days post-ACT. h–j Tumors from all treated mice were harvested, digested, and run through a strainer. Resulting cell suspension was stained for flow cytometry and graphed relative to tumor size (small <100 mm2, medium = 100–200 mm2, large >200 mm2). P values for d, h and i were calculated by one-way ANOVA with a Kruskal-Wallis component. Data with error bars represent mean ± SEM. *P < 0.05; **P < 0.01; ***P < 0.001; ****P < 0.0001

