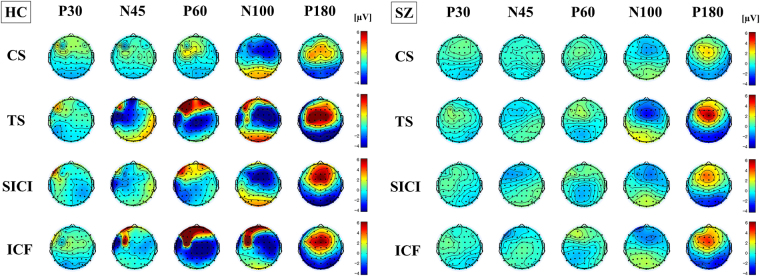
Figure 3.
Topographical plots of paired pulse SICI and ICF paradigms. Left graph shows topographical distribution of healthy controls for each condition (CS, TS, SICI and ICF) and each TEP component (P30, N45, P60, N100, and P180). In healthy controls, TEPs by SICI reduced over the prefrontal area on P60 component, whereas TEPs by ICF increased over the left prefrontal area on P60 (i.e. more excitatory modulation) and N100 (i.e. less inhibitory modulation) components. In contrast, in right graph of patients group, the topographical changes are poor as a whole but there was a reduction of TEP N45 over the left prefrontal area.

