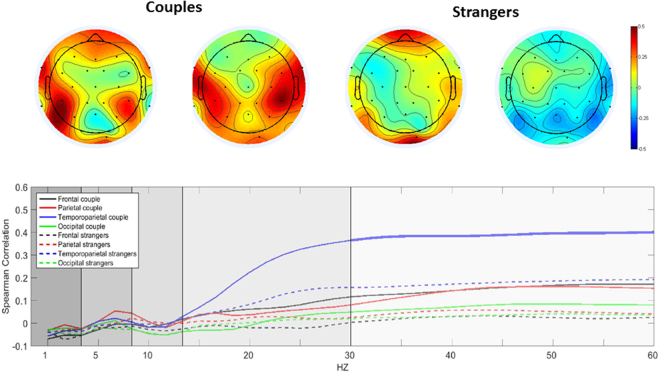
Figure 1.
Top Panel: Example of a spatial distribution of gamma power correlations in one couple dyad and one stranger dyad over the entire scalp. Spearman correlation was applied over the continuous gamma power of similar channels for the male and female of each dyad. Correlations are shown separately for couples and strangers and reflect higher correlations in temporal-parietal areas for couples. Plots are constructed by mapping Spearman correlation using the function topoplot from EEGLab66. Bottom Panel: Dyadic Correlation Spectral analysis. The continuous Fourier transform of each EEG electrode (Stockwell transform) was averaged across ROIs (occipital, frontal, parietal, and temporoparietal) and correlated with the partner’s. Graph shows the correlations values for every frequency bin averaged across groups (couples, strangers). Significant correlation values were found across the gamma frequency (30–60 HZ) over the temporal-parietal area for couples (Thick blue line).

