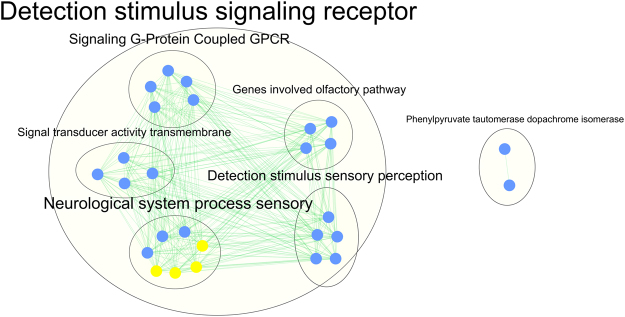
Figure 2.
Results of the gene-set analysis. The map shows a network of gene sets (nodes) related by mutual overlap (edges). A total of 130 genes derived from the genic regional analysis, the analysis of CNVs in candidate genes and the analysis of genic CNVs seen in the T2D group but not in the control group were used as input for the gene-set analysis, which identified 27 gene-sets. Blue circles corresponded to gene-sets with duplications and yellow circles represented gene-sets with duplications and deletions.

