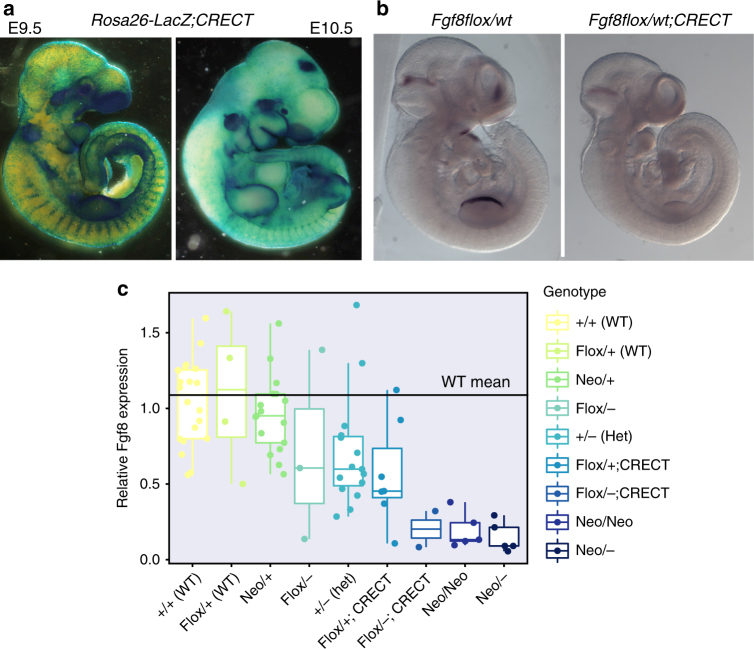
Fig. 2.
Generation of the allelic series. a E9.5 and E10.5 expression of CRECT as detected by crossing CRECT males with B6;129S4-Gt(ROSA)26Sortm1Sor/J (R26R) females and staining the embryos for beta-galactosidase expression. Note the thin layer of blue present over the entire embryo showing the ectodermal CRE expression. b In situ hybridization showing regions of decreased Fgf8 in the E10.0 Fgf8flox/flox;Crect embryos. c qRT-PCR of cranial tissue showing Fgf8 levels by genotype; sample size is between 2 and 22 samples per group. The box represents 1.5× the interquartile range of the data. Allelic series for Fgf8 generates gradual loss of Fgf8 mRNA. Data shown is the delta–delta-CT value, where data were normalized against the mean delta-CT for the WT group. The homozygous null is not included as it is lethal

