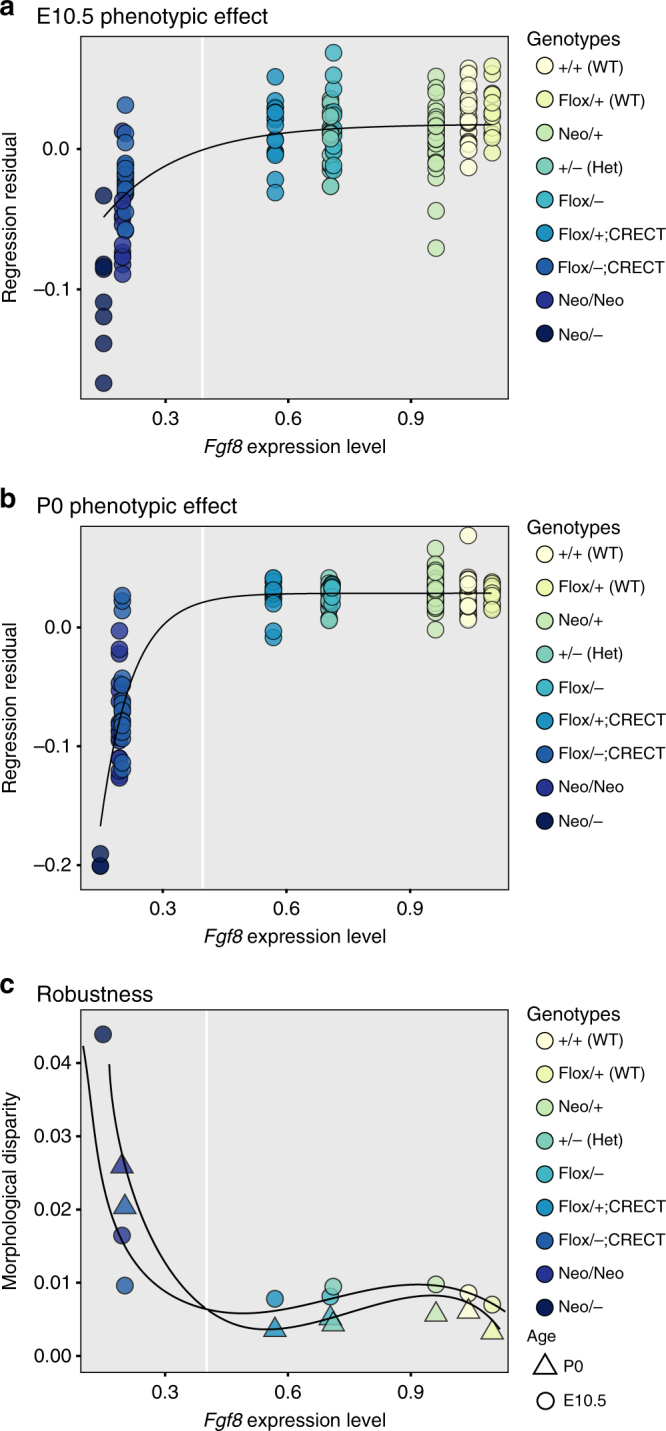
Fig. 5.

Shape and shape variance relate nonlinearly to Fgf8 mRNA expression. Shape is defined using the common allometric component of shape (CAC). a, b Multivariate regression of shape on Fgf8 level at a E10.5 and b P0. The black line shows the von Bertalanffy curve modeled in Fig. 4. c Variance as calculated by the Procrustes variance or morphological disparity49,80. The white vertical line shows an apparent threshold near 40% of wild-type Fgf8 level. P values between groups are shown in Supplementary Table 2
