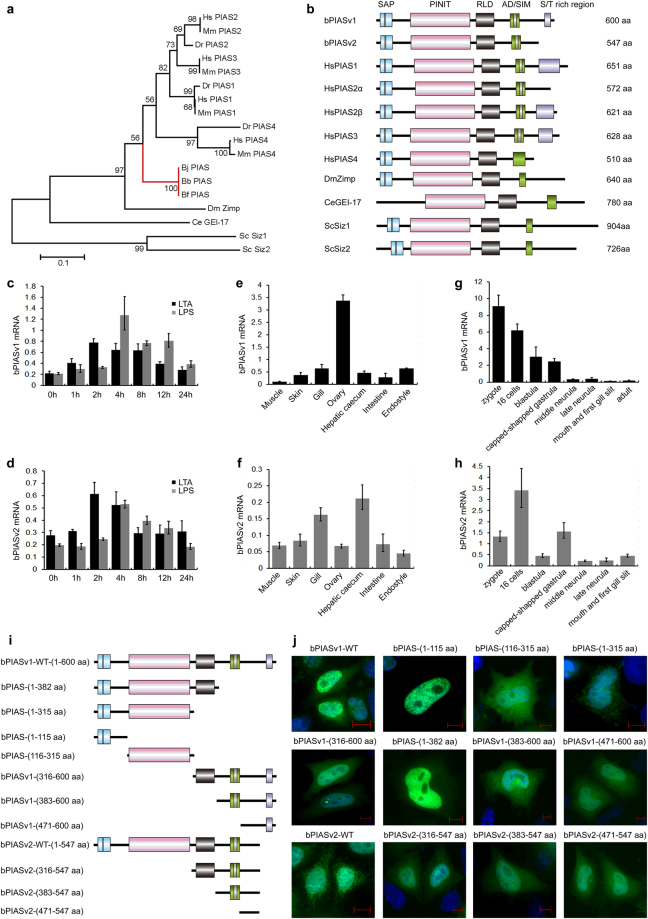
Figure 1.
The sequence, expression and cellular localization of amphioxus PIAS. (a) Phylogenetic analysis of PIAS proteins based on the highly conserved RLD domain. The tree was inferred using MEGA7 with the Maximum Likelihood method and 500 bootstrap tests. (b) The protein architecture of PIAS family members. The sequence length is indicated. (c,d) qRT-PCR analysis of the time course of bPIASv1 and v2 mRNA expression dynamics after challenge with LTA and LPS. Note that the 0 h of treatment is equivalent to the unchallenged animals. (e,f) qRT-PCR analysis of bPIASv1 and v2 mRNA expression in different tissues. (g,h) qRT-PCR analysis of dynamic bPIASv1 and v2 mRNA expression during amphioxus embryogenesis. The data were expressed as a ratio between bPIASv1 or v2 mRNA and the mRNA expression level of GAPDH. (i) The truncated mutants of bPIAS used in this study. (j) The subcellular localization of full-length bPIASv1 and v2 and the associated truncated mutants. The scale bar indicates 10 µm.

