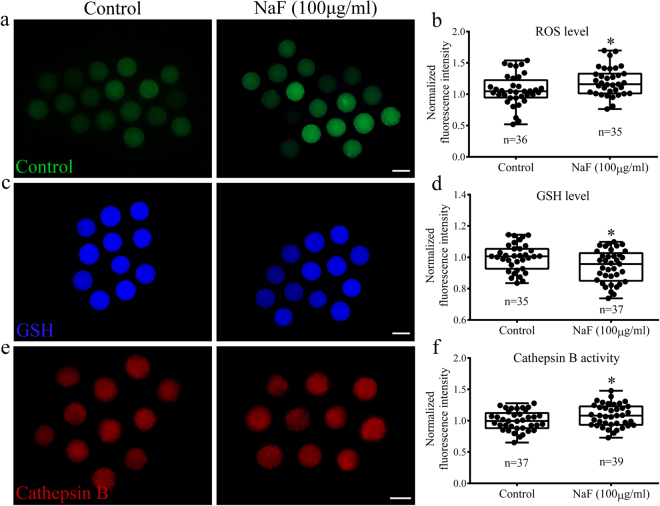
Figure 7.
NaF exposure effects on ROS level, GSH level, and cathepsin B activity in porcine oocytes. (a) NaF exposure increased ROS generation. (b) Relative fluorescence intensity of ROS in control and NaF-treated oocytes. (c) NaF exposure decreased GSH level. (d) Relative fluorescence intensity of GSH in control and NaF-treated oocytes. (e) NaF exposure increased cathepsin B activity. (f) Relative fluorescence intensity of cathepsin B in control and NaF-treated oocytes. Scale bar = 100 μm. Data are presented as mean ± SD of three independent experiments. Statistically significant differences are indicated by asterisks (*p < 0.05).

