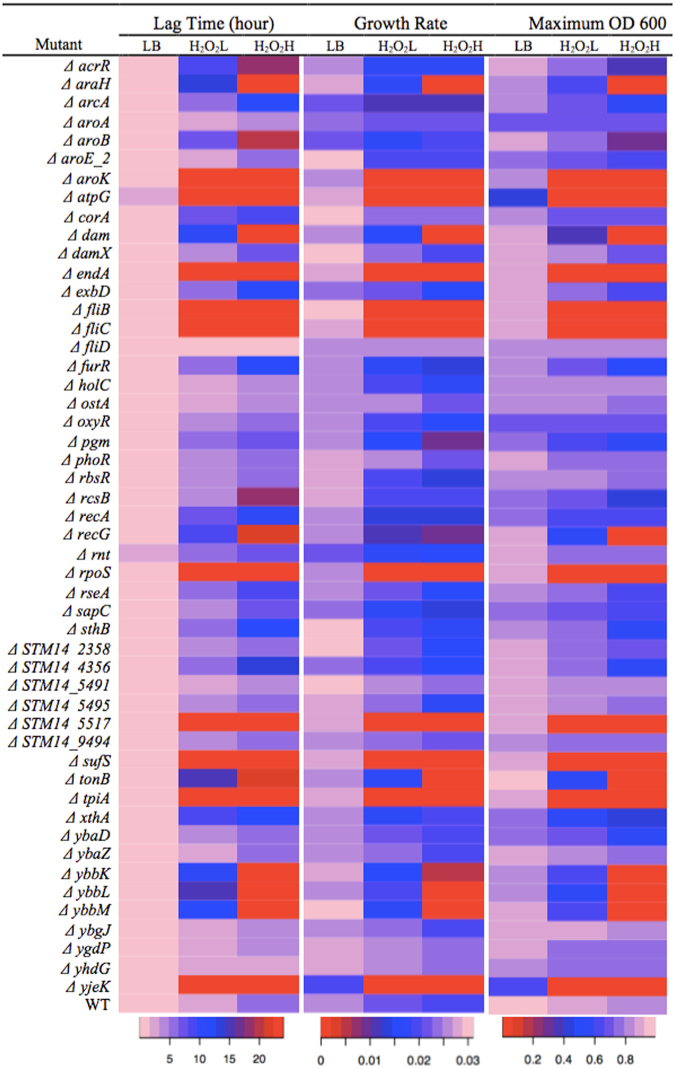
Figure 2.
Growth curve of 50 mutants and a wild type S. Typhimurium in LB, H2O2L and H2O2H. The lag phase time, growth rate, and maximum OD600 of the individual S. Typhimurium mutants and the wild type were measured in LB media supplemented with no H2O2 (LB), 2.5 mM H2O2 (H2O2L) or 3.5 mM H2O2 (H2O2H). Overnight culture of each of the mutants and wild type was diluted 1:200 in LB, H2O2L and H2O2H. The cultures were incubated at 37 °C for 24 h in a 96-well plate and the OD600 was recorded every 10 min. The lag phase time, growth rate, and maximum OD600 were calculated and shown here as a graphical representation. The pale pink color indicates a short lag phase time, a high growth rate, and a high OD600. The red color indicates that the bacteria stayed in a lag phase, growth rate was close to a zero, and OD600 of the culture did not increase during the 24 h time of the assays. The data of this figure can be found in Table S4.

