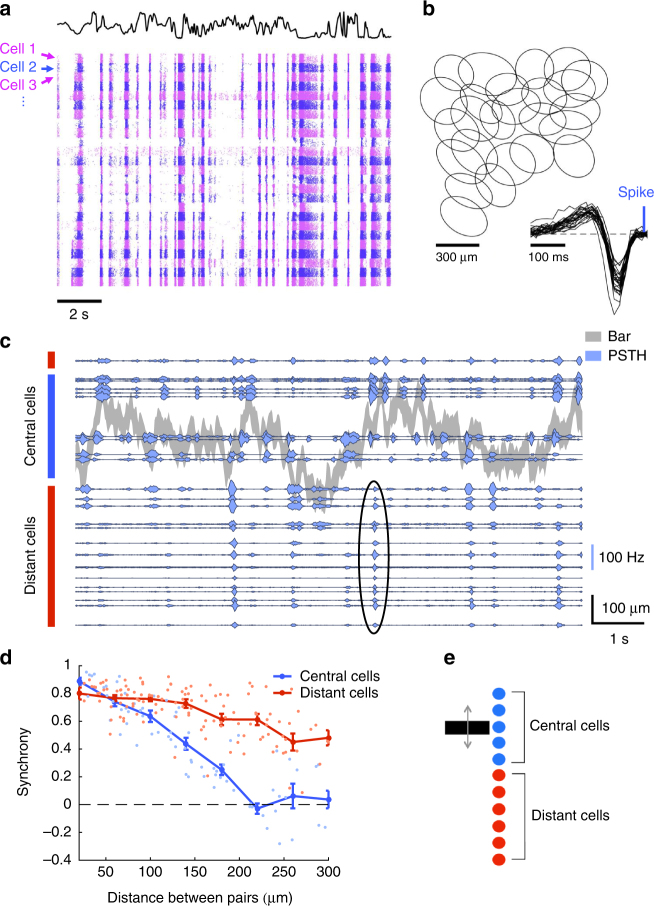
Fig. 1.
A single-cell type responds synchronously to distant moving objects. a Raster of 25 cells of the same type responding to a full field uniform flicker. Each line corresponds to a repeat of the stimulus, and each cell is indicated by a different color (alternating pink and blue). The black curve indicates the light intensity of the flicker over time. b Receptive fields of a population of ganglion cells of the same type. Each ellipse represents the position and shape of the spatial receptive field associated with one cell (1-SD contour of the 2D Gaussian fit to the spatial profile of the RF). Inset: temporal profiles of the receptive fields of the same cells. c PSTHs of multiple ganglion cells responding to repeated presentations of a randomly moving bar. Gray shade: position of the bar as a function of time (shade width corresponds to the bar width). Blue traces: PSTHs of individual ganglion cells, with baselines positioned to scale relative to the bar. Blue and red vertical rectangles indicate central and distant cells, respectively. Black ellipse shows an example synchronous firing event of the distant cells. d Cross-correlation between PSTHs of pairs of cells, as a function of their pairwise distance measured along the bar motion axis, shown separately for cells whose receptive field center either was (blue) or was not (red) stimulated by the bar. Curves: average values ± SEM. e Schematic diagram shows central cells (blue) and distant cells (red) that respond synchronously

