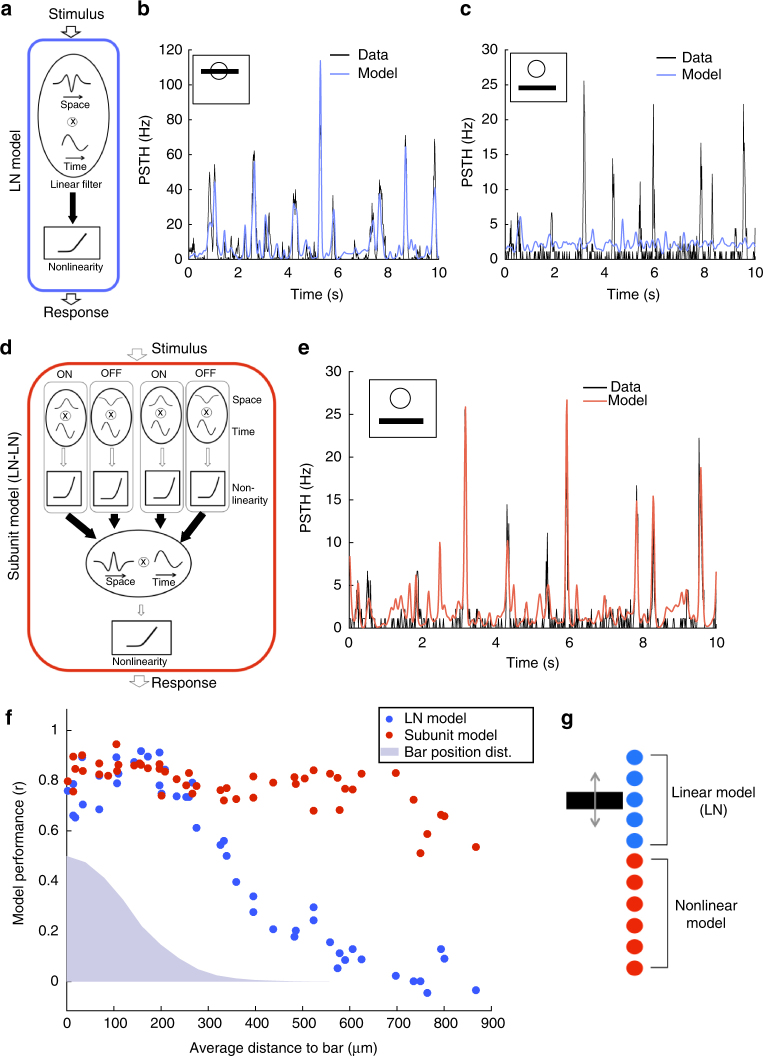
Fig. 2.
OFF ganglion cells perform a quasilinear computation in their receptive field center, and a nonlinear computation in the surround. a Schematic of the LN model, composed of a linear filter and static nonlinearity. b Response (PSTH, black) of a ganglion cell whose receptive field center is stimulated by the bar, is predicted by the LN model (blue). r = 0.89. c Response (PSTH, black) of the same ganglion cell when the bar is far from the receptive field center, is not predicted well by the LN model (blue). r = 0.02. d Schematic of the subunit model, composed of a first stage (each subunit linearly filters the stimulus and applies a static nonlinearity), followed by weighted linear pooling and a second nonlinearity. Filled arrows correspond to learned weights of the model. e Response (PSTH, black) of the same ganglion cell (as in b, c) to distant stimulation is predicted well by the subunit model (red). r = 0.83. f Performance of the LN (blue) and subunit (red) models in predicting ganglion cell responses, as a function of the distance of the cell to the bar. Blue shade: position distribution of the bar. g Schematic showing that cells whose receptive field center is on top of the moving bar perform a quasilinear computation while distant cells perform a nonlinear computation

