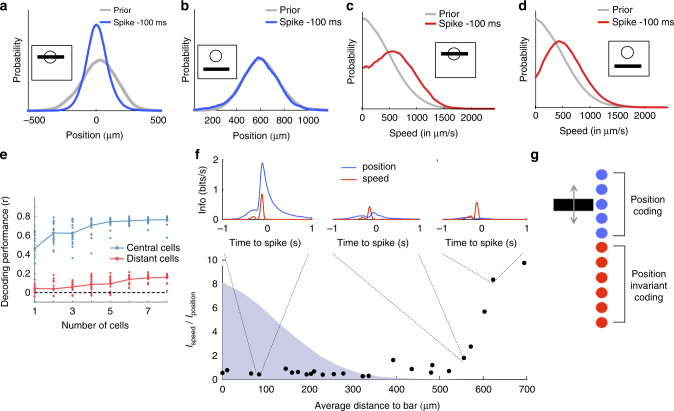
Fig. 6.
Central computation codes for position, while distant computation is invariant to position and codes for stimulus change. a Distribution of the bar positions for the complete stimulus trajectory (“prior distribution”, gray) and 100 ms before the spike of a central cell (blue). Zero corresponds to the location of the cell’s receptive field (RF) center. b Same as A for a distant cell with its receptive field center far from the bar. c Distribution of the absolute speed of the bar for the complete stimulus trajectory (gray) and 100 ms before the spike of a central cell (red). d Same as c for a distant cell (red). e Decoding performance of the position of the bar using linear decoding, against number of cells, for either central cells (blue) or distant cells (red). Each point corresponds to one subset of cells, and the curves correspond to the average performance. f Ratio between the information individual cells carry about bar speed vs about bar position, as a function of the average distance to the bar. Distribution of bar positions is shown as a blue shade. For selected cells, the insets indicate the mutual information between the spiking response and the position (blue) or the speed (red) at different time delays. g Schematic showing that central cells code for bar position while distant cells are nearly invariant to it

