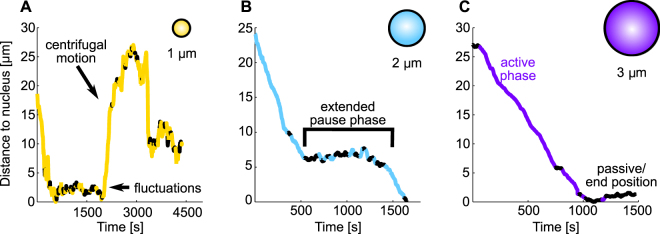
Figure 2.
Examples of the phagosome trajectories for particles with different diameters. Shown are representative trajectories of particles with a diameter of 1 µm (A), 2 µm (B) and 3 µm (C). Plotted are the distances of the particle position to the nearest point of the nucleus as a function of time. The trajectories were subdivided into segments with a length of 30 seconds. The classification into segments of active (bright/colored trajectory parts) and passive motion (dark/black trajectory parts) was done as described in the Materials and Methods section. (A) Particles with a diameter of 1 µm typically had frequent phases of active centrifugal motion and frequent phases of passive fluctuations. (B) Particles with a diameter of 2 µm typically had extended pause phases that interrupted the active motion phases before the nucleus was reached. (C) Long persistent phases of active centripetal motion and passive phases after the nucleus was reached were typical for particles with a diameter of 3 µm. Frequent well-defined end positions close to the nucleus were observed only for the 2 µm and 3 µm particles, but not for the 1 µm particles.

