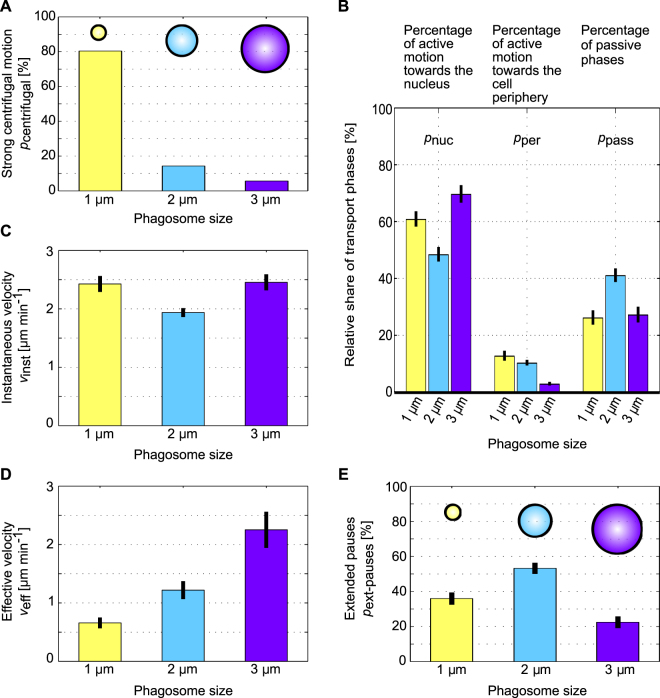
Figure 3.
Size-dependent characteristics of phagosomal transport. (A) Percentage pcentrifugal of phagosomes that show a strong centrifugal motion towards the cell periphery after reaching the nucleus. Small phagosomes with a diameter of 1 µm show a strong centrifugal transport in 82% of cases, whereas medium- and large-sized phagosomes show such transport in only 17% and 6% of the cases, respectively. (B) Relative share of different phases of phagosomal transport. Phagosomes with a diameter of 3 µm show the highest percentage of active motion towards the nucleus, pnuc, and the smallest percentage of active motion towards the periphery, pper. Phagosomes with a diameter of 2 µm show the largest percentage of passive motion, ppass. Phagosomes with a diameter of 1 µm show the largest percentage of active motion towards the cell periphery. (C) Instantaneous transport velocities, vinst. These velocities are similar to each other for the three different phagosome sizes and range between 1.9 and 2.5 µm min−1. (D) Effective velocities of the whole active phagosome transport, veff. These velocities strongly depend on the particle diameter and increase with the phagosome size. (E) Percentage of extensive pause phases, pext-pauses. Particles with a diameter of 2 µm show the highest percentage of extended pauses. Error bars are the std. error of the mean. We analyzed 51, 63, and 53 trajectories for the phagosomes with 1 µm, 2 µm, and 3 µm diameters.

