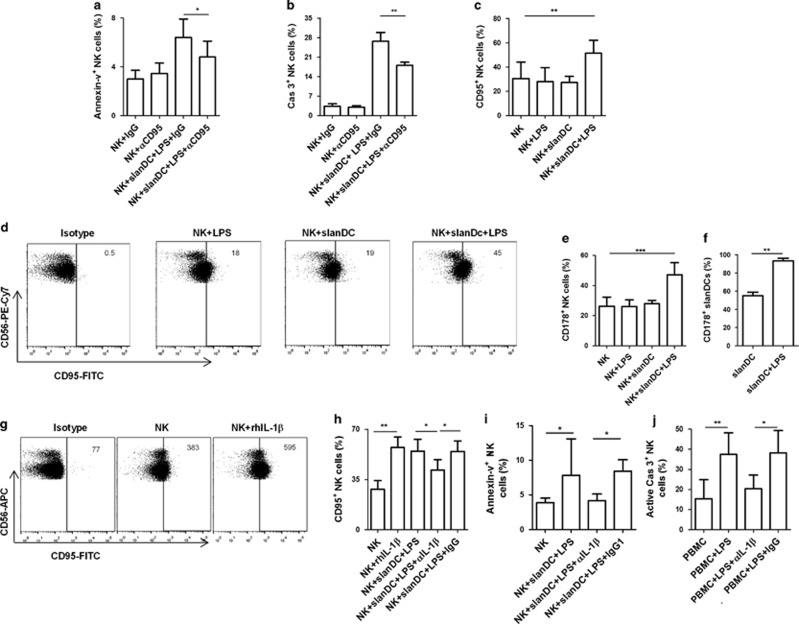
Figure 4.
IL-1β induces the expression of CD95 in NK cells to induce apoptosis. Freshly isolated NK cells and slanDCs were coincubated for 16 h in the presence or absence of LPS. The coculture was also performed in the presence of antagonistic anti-CD95 (ZB4), anti-IL-1β blocking antibody or isotype IgG. NK cells or slanDCs were also cultured with or without LPS or rhIL-1β. Finally, NK cells (in PBMCs) were cultured for 16 h with or without LPS, anti-IL-1β blocking antibody or isotype IgG. (a and i) NK cells were evaluated for apoptosis using flow cytometry, and the percentage of early (Annexin-V+7AAD−) apoptotic cells are shown (n=5 and 9/group, respectively). (b, j) NK cells were stained for intracellular active caspase-3 expression, and the percentage of active caspase-3+ cells is shown (n=4 and 6/group, respectively). (c, h) NK cells were stained for CD95 expression, and the percentage of CD95+ cells is shown (n=7 and 5/group, respectively). (d, g) NK cells were stained for CD95 expression, and dot plots are shown. The data are representative of seven and five independent experiments, respectively. The values represent the percentage (d) or MFI (g) of CD95+ NK cells. (e, f) NK cells (e) or slanDCs (f) were stained for CD178 expression, and the percentage of CD178+ cells is shown (n=6/group). (a–c, e, f, h–j) The data are shown as the mean±s.d. and are representative of four to nine independent experiments. *P<0.05, **P<0.01 and ***P<0.001, paired two-tailed t-tests (f) or one-way ANOVA followed by Bonferroni posttests (a–c, e, h–j).

