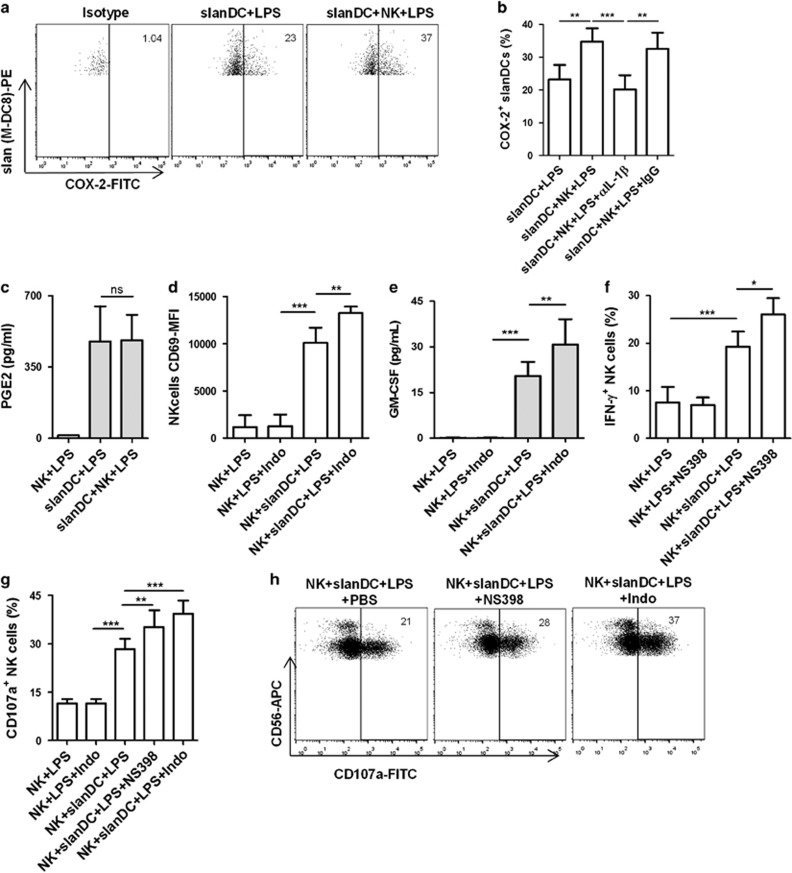
Figure 5.
IL-1β induces COX-2 expression in slanDCs to restrain the activity of NK cells. Freshly isolated NK cells and slanDCs were coincubated for 16 h in the presence of LPS. The coculture was also performed in the presence of COX inhibitors [Indomethacin (Indo) or NS398], anti-IL-1β blocking antibody or isotype IgG. NK cells or slanDCs were also cultured with LPS or Indomethacin. (a) slanDCs were stained for COX-2 expression, and dot plots are shown. The data are representative of five independent experiments. The values represent the percentage of COX-2+ slanDCs. (b) slanDCs were stained for intracellular COX-2 expression, and the percentage of COX-2+ slanDCs is depicted (n=5/group). (c) Supernatants were analyzed for PGE2 using ELISA, and the concentration (pg/ml) is shown (n=6/group). (d) NK cells were stained for CD69 expression, and the percentage of CD69+ NK cells is shown (n=6/group). (e) Supernatants were analyzed for GM-CSF using CBA, and the concentration (pg/ml) is shown (n=5/group). (f) NK cells were stained for intracellular IFN-γ expression, and the percentage of IFN-γ+ NK cells is shown (n=4/group). (g) NK cells were separated from slanDCs, and a CD107a degranulation assay was performed using K562 target cells. The percentages of CD107a+ cells are shown (n=6/group). (h) A CD107a degranulation assay was performed using K562 target cells, and dot plots are shown. The data are representative of six independent experiments. The values represent the percentage of CD107a+ cells. (b–g) The data are shown as the mean±s.d. and are representative of four to six independent experiments. *P<0.05, **P<0.01 and ***P<0.001, one-way ANOVA followed by Bonferroni posttests (b–g).

