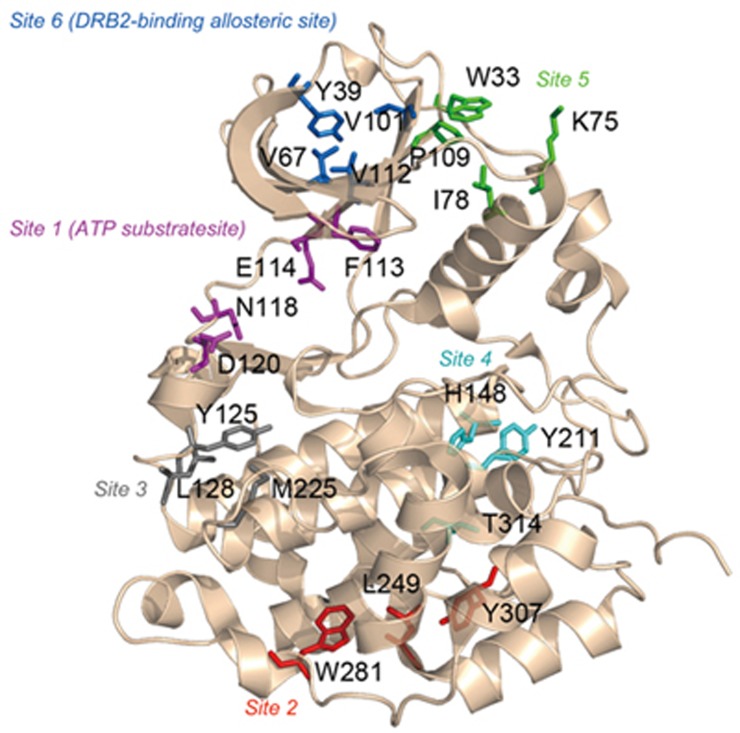
Figure 1.
Predicted allosteric sites using the Allosite method. The structure of CK2α is represented by a cartoon, and the residues at the predicted sites are shown in sticks. Residues at site 1 (ATP substrate site) are colored in purple, residues at site 2 are colored in red, residues at site 3 are colored in gray, residues at site 4 are colored in cyan, residues at site 5 are colored in green, and residues at site 6 (DRB2-binding allosteric site) are colored in blue.

