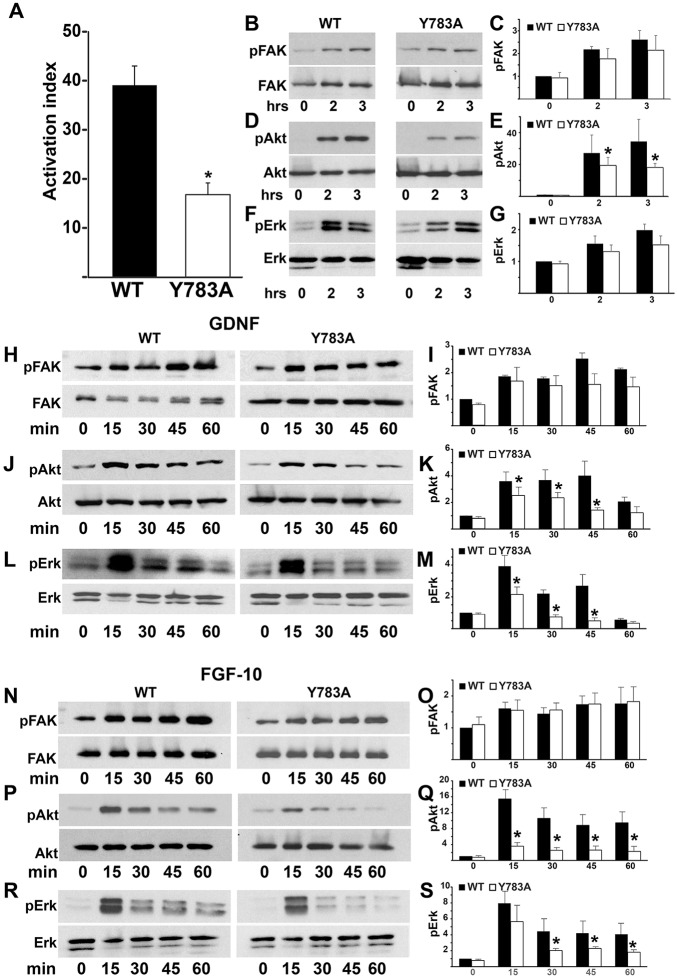
Fig. 5.
Y783A mutations in the β1-integrin tail alter integrin-dependent activation and signaling. (A) The β1-integrin activation index was determined as described in the Materials and Methods. Data are mean±s.d. of three experiments performed in triplicate. *P<0.05 (between cells expressing wild-type and Y785A integrin). (B-G) Wild-type and Y783A CD cells were plated in serum-free medium on Ln-511. Cells were lysed and lysates were analyzed by western blotting for levels of phosphorylated and total FAK (B), Akt (D) and Erk1/2 (F). Phosphorylated protein levels were measured by densitometry using Image J and normalized to total protein. The fold changes in phosphorylated/total protein at different time points relative to the Y783A mutant at the ‘0’ time point are shown in C,E,G. *P<0.05 (between cells expressing wild-type and mutant integrins). (H-M) Wild-type and Y783A CD cells were allowed to adhere to Ln-511 for 1 h, after which they were treated with GDNF for the times indicated. The cells were then lysed and analyzed by western blotting for levels of phosphorylated and total FAK (H), Akt (J) and Erk1/2 (L). Levels of phosphorylated proteins were measured by densitometry and normalized to total protein, as indicated above. Data are mean±s.d. of five experiments. *P<0.05 (between wild-type and mutant integrins). (N-S) Wild-type and Y783A CD cells were allowed to adhere to Ln-511 for 1 h, after which they were treated with FGF for the times indicated. Cell lysates were analyzed for levels of phosphorylated and total FAK (N), Akt (P) and ERK1/2 (R). Levels of phosphorylated proteins were measured by densitometry and normalized to total protein, as indicated above. *P<0.05 between cells expressing wild-type and mutant integrins (O,Q,S).

