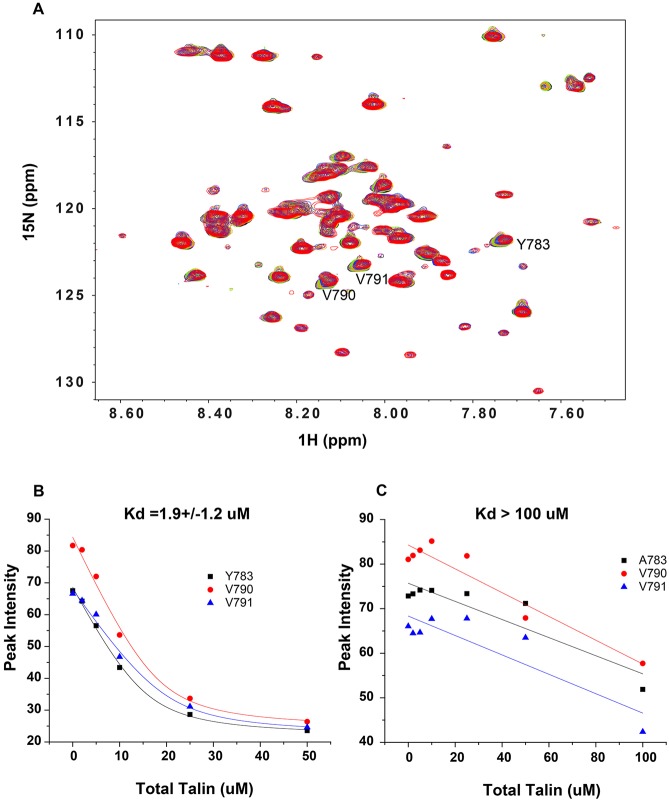
Fig. 6.
Talin 1 head domain binding to integrin β1 in a bilayer environment is decreased by a mutation in the membrane-proximal NPxY motif of integrin β1. The unlabeled talin head domain (F0-F3) was titrated into a solution containing the 15N-labeled integrin β1 TM/CTD domain in D7PC/POPC/POPS bicelles (as described in the Materials and Methods). 1H,15N-TROSY NMR experiments were carried out. (A) Superimposed NMR spectra of 15N-labeled wild-type integrin β1 TM/CTD (0.2 mM) in the presence of different concentrations of unlabeled talin head domain (F0-F3): black (0 μM), pink (2 μM), green (5 μM), yellow (10 μM), blue (25 μM) and red (50 μM). Not shown is the spectrum for an additional titration point at 75 µM talin F0-F3, where the peaks disappeared completely, indicative of complete saturation to form a spectroscopically invisible complex. (B) Fit of talin head titration data using a 1:1 binding model (Eqn 1 in the Materials and Methods) for complex formation between the talin 1 head domain and wild-type 15N-labeled integrin β1 TM/CTD. Fits of the reductions in peak intensities are shown for integrin β1 TM/CTD amide peaks from sites Y783, V790 and V791 residues, yielding an average Kd of 1.9±1.2 μM. (C) Data for titration of the talin 1 head domain to 15N-labeled Y783A mutant integrin β1 TM/CTD. The NMR spectra from which these data were derived appear in Fig. S1. An attempt was made to analyze the data the same way as for the wild-type integrin β1 TM/CTD. However, statistically meaningful results could not be obtained because the data exhibit no curvature (indicating <50% saturation even at the highest talin concentration tested; 100 μM). This suggests that the Kd for complex formation between a single talin head domain with a single integrin β1 trimer is >100 µM.

