Fig. 5.
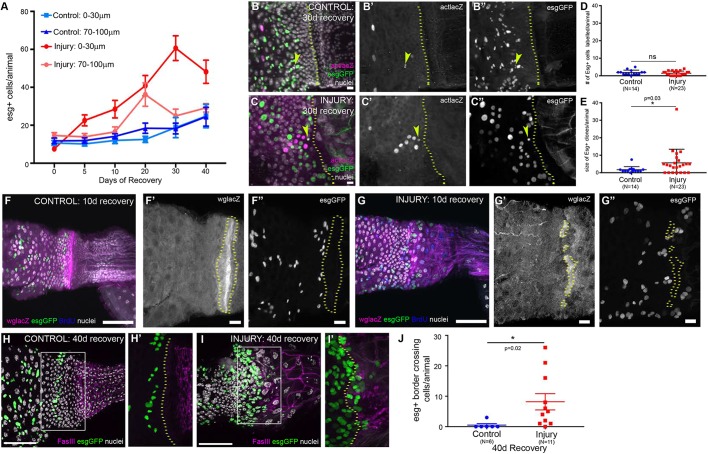
Injury to the adult HZ/hindgut causes OB-ISC hyperplasia. (A) After injury, esg+ cells near the HZ expand. Data represent mean±s.e.m. (see also Fig. S5A). (B-E) This expansion is driven by esg+ cell division. Control (B-B″) and injury clone (C-C″) examples; arrowheads indicate a marked esg+ cell clone. (D) Lineage tracing marks a similar number of esg+ cells. Data represent mean±s.e.m. Unpaired, two-tailed t-test, unequal variance. (E) esg+ clones are larger after injury. Data represent mean±s.e.m. Unpaired, two-tailed t-test, unequal variance. (F-G″) Injury creates breaks in the HZ. In the absence of injury, the HZ remains intact (F-F″). After injury, breaks are frequently observed and esg+ are found posterior to the HZ (G-G″). (H-J) esg+ cells cross the FasIII boundary. esg+ cells rarely cross the boundary in the absence of injury (H,H′). After injury, esg+ cells do cross the boundary (I,I′). (J) Quantification of esg+ cells that cross the boundary after injury. Data represent mean±s.e.m. Unpaired, two-tailed t-test, unequal variance. Genotypes and markers are indicated within panels; yellow dotted lines indicate the HZ. Scale bars: 50 µm in F,G,H and I; 10 µm in B,C,F′,F″,G′ and G″.

