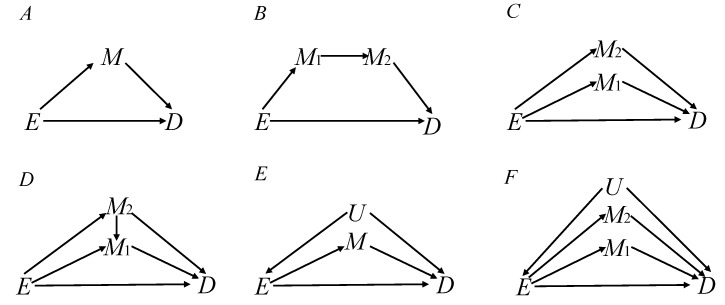
Figure 1.
Six causal diagrams were designed for estimating the causal effect of E on D. (A) a single mediator M; (B) two series mediators M1 and M2; (C) two independent parallel mediators M1 and M2; (D) two correlated parallel mediators M1 and M2; (E) a single mediator with an unobserved confounder U; (F) two independent parallel mediators M1 and M2 with an unobserved confounder U.

