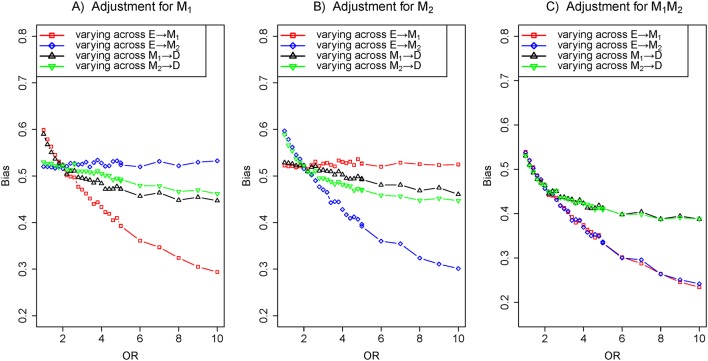
Figure 8.
The biases with the effects of E→M1 (red), E→M2 (blue), M1→D (black) and M2→D (green) increasing, respectively. Comparison of the bias of different effects in three adjustment models: (A) adjustment for M1, (B) adjustment for M2 and (C) adjustment for M1 and M2. The OR of target effects (eg, E→M1) from 1 to 10 given the effects of causal edges fixed ln2 and the effect of confounder edges fixed ln5 (colour figure online).

