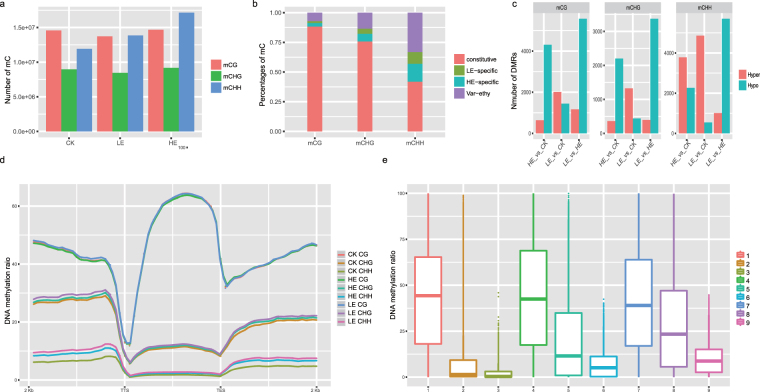
Figure 5.
Summary of DNA methylation. (a) Statistics on the numbers of mCs. (b) The distribution of mCs in CK, LE and HE. (c) The statistics of DMRs. (d) The mean DNA methylation level of in the different gene regions. (e) The box-plot of DNA methylation level in the different gene region. 1: CG methylation in gene upstream; 2: CHG methylation in gene upstream; 3: CHH methylation in gene upstream; 4: CG methylation in gene downstream; 5: CHG methylation in gene downstream; 6: CHH methylation in gene downstream; 7: CG methylation in gene body; 8: CHG methylation in gene body; 9: CHH methylation in gene body.

