Figure 1.
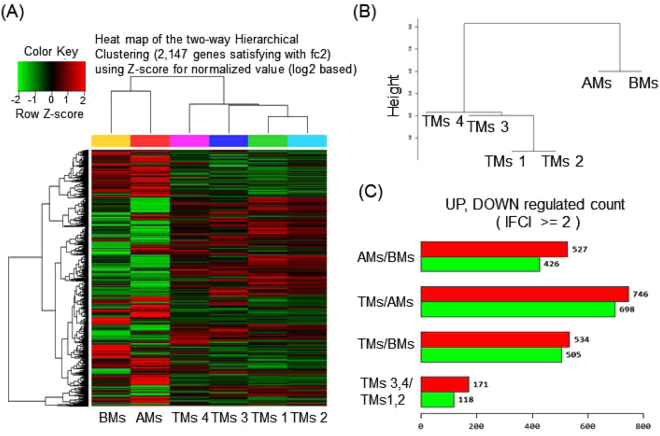
RNA-seq data analysis of BMs, AMs, and TMs. (A) Heatmap of hierarchical clustering indicate differentially expressed genes (rows) between BMs, AMs, and four samples of TMs. (fold-change > 2, P < 0.05). Red indicates up-regulation and green indicates down-regulation. (B) Dendrogram of hierarchical clustering indicates the interclass correlation between the three MSC groups. (C) The differentially expressed genes between AMs, BMs, and TMs are shown as up-regulated or down-regulated.

