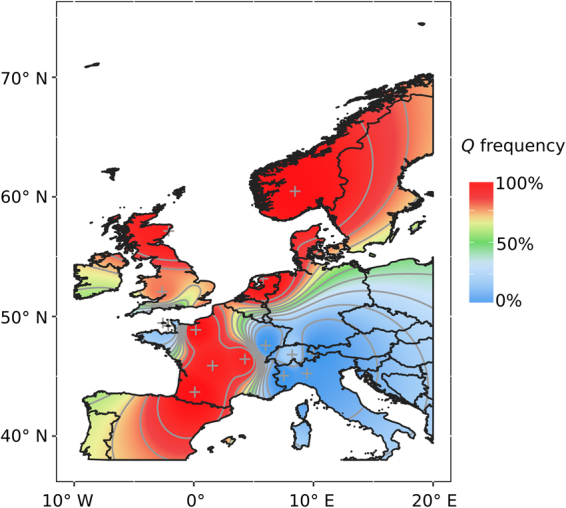
Figure 5.

Atlantic Europe as the most likely centre of recent selection for Q. The heatmap was generated with ggplot2 v2.1.076 using inverse weighted distance exact interpolation of GGGTTCG frequency from breed origin (crosses).

Atlantic Europe as the most likely centre of recent selection for Q. The heatmap was generated with ggplot2 v2.1.076 using inverse weighted distance exact interpolation of GGGTTCG frequency from breed origin (crosses).