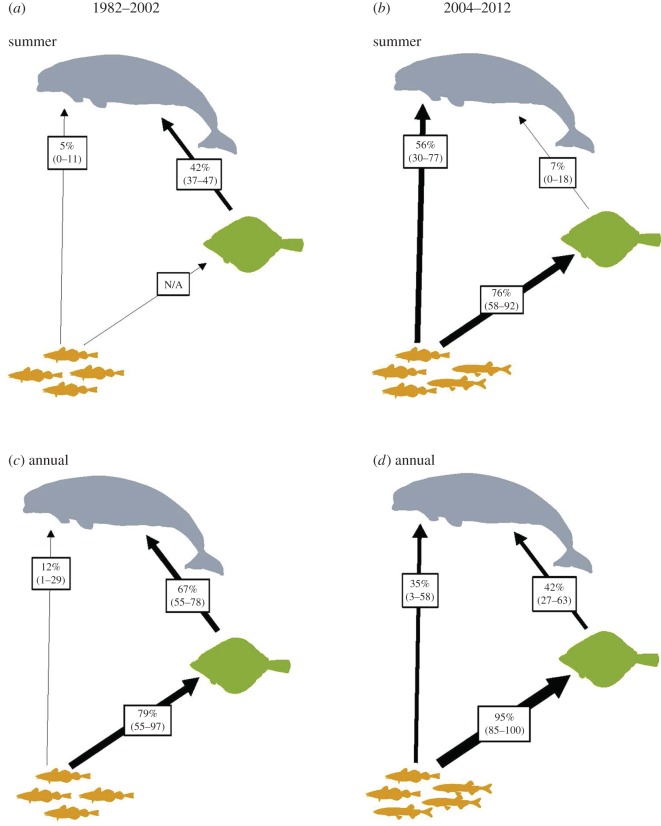
Figure 1.
Median contributions (95% Bayesian credible interval) to beluga and Greenland halibut diet estimated from stable isotope mixing models from 1982–2002 and 2004–2012 in an AIGP context derived from skin–liver (summer) (a,b) and muscle (annual) (c,d), respectively. Symbols represent beluga (grey), Greenland halibut (green) and forage fish (Arctic cod 1982–2002, and capelin/Arctic cod 2004–2012; yellow).

