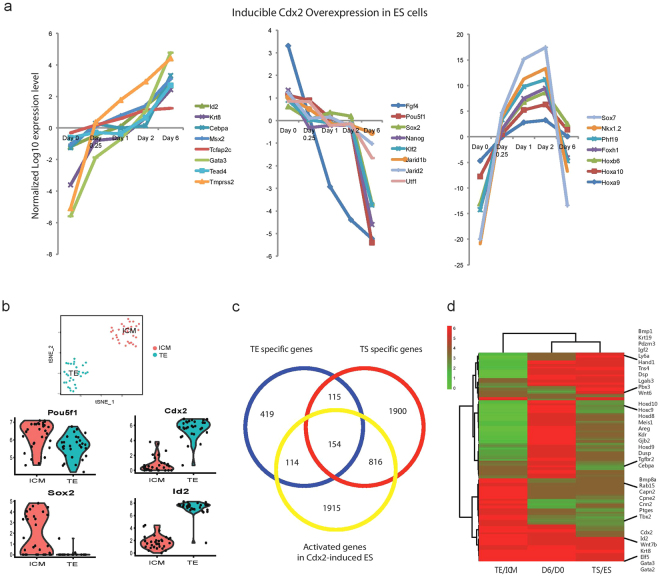
Figure 1.
Comparison of expression profiles from different trophoblast cellular systems. (a) Cdx2 over-expression in ES cells induces trophoblast differentiation. The plot depicts gene expression changes of selected genes (average in three inducible Cdx2 over-expressing ES clones) during the differentiation time course. (b) A t-SNE plot to compare gene RPKM values in the 64-cell stage embryo TE cells and the ICM cells. Examples of TE specific markers and ICM enriched genes are showed in violin plot. (c) Comparison of TE specific gene list (from 64-cell stage embryo scRNA-Seq data), TS specific gene list (from microarray profiles of TS cells compared to ES cells, Kidder and Palmer, 2010) and Cdx2 OE upregulated gene list (from microarray profiles of Day 6 Cdx2 over-expression compared to Day 0 un-induced ES cells). (d) Gene expression heatmap comparing lineage-specific and shared markers in different trophoblast systems.

