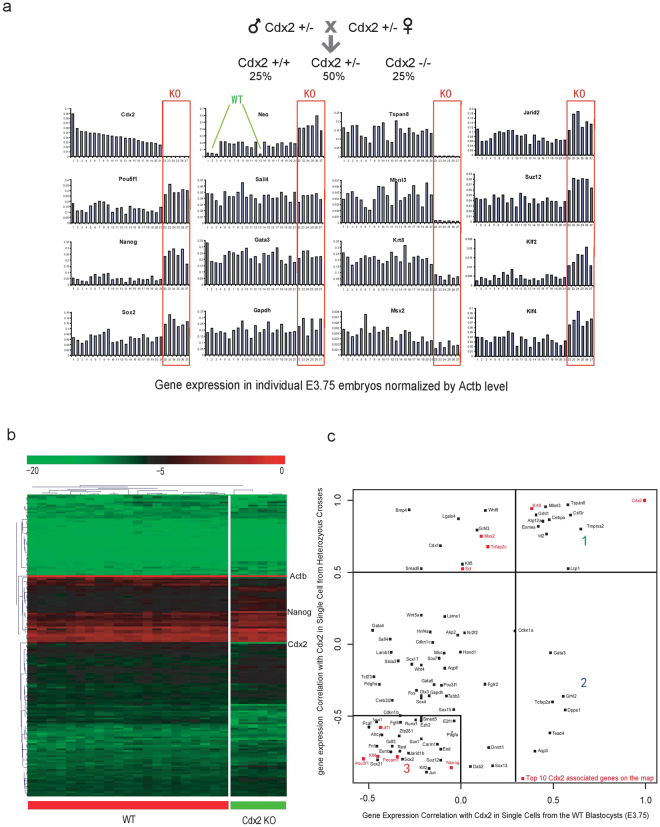
Figure 2.
Identification of Cdx2 functional targets in vivo from E3.5 Knockout blastocysts. (a) qPCR analysis of E3.75 blastocysts derived from Cdx2 heterozygous intercrosses. Each bars represents one blastocyst. All expression levels are normalized against endogenous control Actb. The order of the embryos is sorted according to Cdx2 expression. (b) Hierarchical clustering of expression profiles of all analyzed individual blastocysts. (c) Expression correlation map of different genes to Cdx2. X-axis indicates gene correlation with Cdx2 in single cells harvested from ~E3.75 wild type embryos. Y-axis indicates gene correlation with Cdx2 in E3.75 blastocysts harvested from Cdx2+/− intercrosses. See text for discussion of cluster 1, 2, and 3.

