Figure 3.
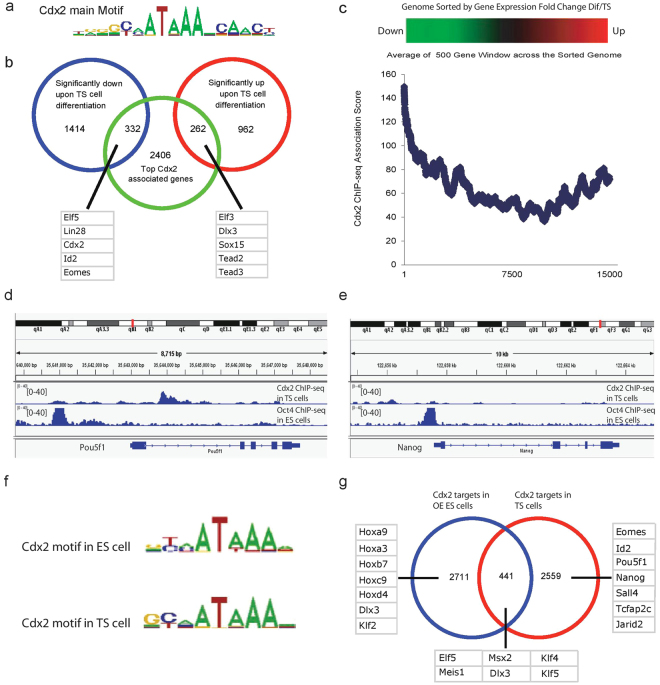
Cdx2 ChIP-Seq analysis in TS cells reveals direct targets of Cdx2 (See also Fig. S1). (a) Cdx2 main binding motif clusters identified with CisFinder via 200 bp sequences centered at ChIP sites. (b) Venn diagram showing the overlap between Cdx2 target list and the significantly up/down regulated genes after 6 days of TS cell differentiation. Representative Cdx2 targets are listed. (c) Blue line: relationship between gene expression difference and TF ChIP-Seq association score. X-axis shows the gene rank after sorting the genome according to expression fold change between differentiated and undifferentiated TS cells (Kidder and Palmer, 2010). Y-axis shows the average Cdx2 binding association score from a sliding window of 500 genes. (d) Oct4 ChIP-Seq peaks (from ES cells) and Cdx2 ChIP-Seq peaks (from TS cells) in the Pou5f1 gene region viewed with USCS mouse mm8 browser. (e) Oct4 ChIP-Seq peaks (from ES cells) and Cdx2 ChIP-Seq peaks (from TS cells) in the Nanog gene region viewed with USCS mouse mm8 browser. (f) Analysis of Cdx2 ChIP-seq results from our TS cell system and the ES cell Cdx2 overexpression system (Nishiyama et al.12) reveals strikingly similar core Cdx2 binding motifs. (g) Although Cdx2 does not bind to Pou5f1, Sox2 and Nanog in the ES cell TE differentiation system (Nishiyama et al.12), we have observed significant repressive bindings of Cdx2 on pluripotent genes in the established TS cell system.

