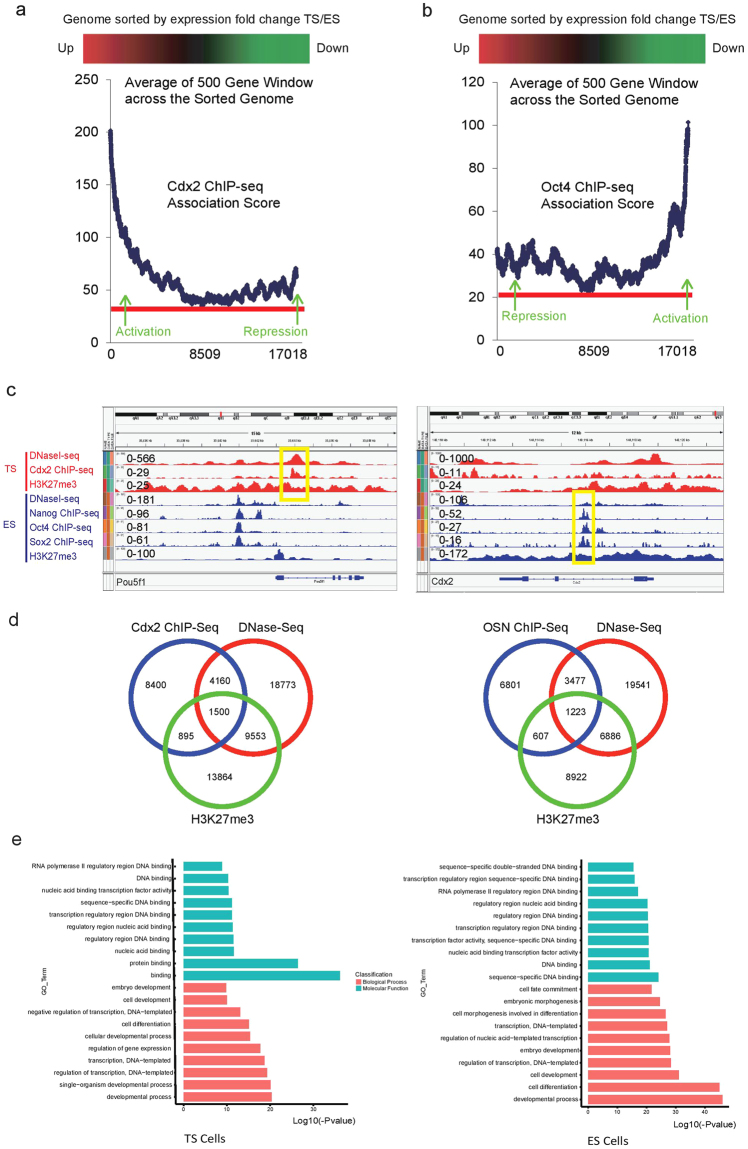
Figure 4.
Cdx2 directly competes with Oct4 on genome-wide regulation of lineage segregation (See also Figs S2 and S3). (a) Relationship between gene expression difference of TS/ES and Cdx2-ChIP-Seq association score. X-axis shows the gene rank after sorting the genome according to expression fold change between TS and ES cells. Y-axis shows the average Cdx2 binding association score from a sliding window of 500 genes. (b) Relationship between gene expression difference of TS/ES and Oct4-ChIP-Seq association score. X-axis shows the gene rank after sorting the genome according to expression fold change between TS and ES cells (Kidder and Palmer, 2010). Y-axis shows the average Oct4 binding association score from a sliding window of 500 genes. (c) Cdx2 ChIP-Seq peaks, H3K27me3 Peaks, DNase Peaks from TS cells in the Pou5f1 gene region viewed with IGV; OSN ChIP-Seq peaks, H3K27me3 Peaks, DNase Peaks from ES cells in the Cdx2 gene region viewed with IGV. OSN: Oct4-Sox2-Nanog. (d) Venn diagram show silencer candidates in TS cell (left); Venn diagram show silencer candidates in ES cell (right). (e) GO analysis of silencer-related genes in TS cells; GO analysis of silencer-related genes in ES cells.

