Figure 3.
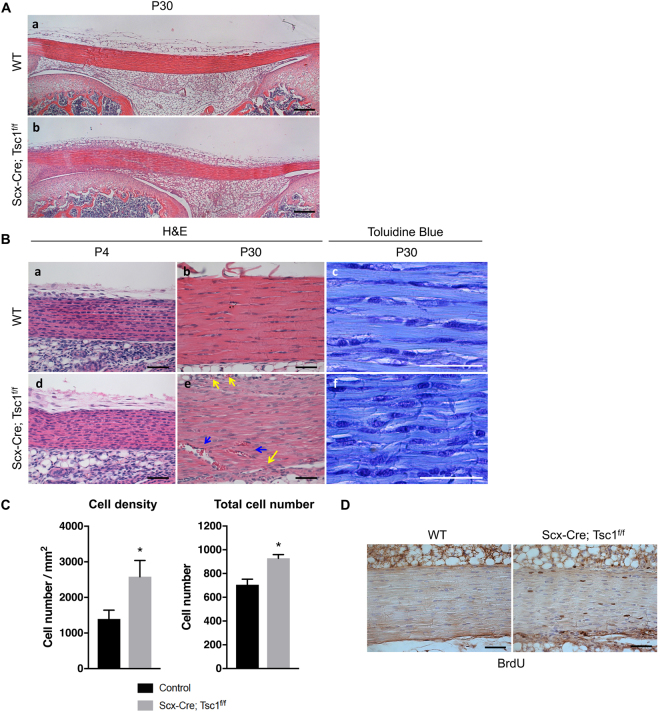
Gain of mTORC1 signaling induces tendon abnormalities. (A) Hematoxylin and Eosin (H&E) staining of patellar tendons from wild-type (WT) (a) and Scx-Cre; Tsc1 f/f littermates (b) at P30. Scale bars indicate 200 μm. (B) H&E and toluidine blue-stained sections of patellar tendons from WT (a–c) and Scx-Cre; Tsc1 f/f littermates (d–f) at P4 and P30. Scale bars indicate 50 μm. Arrows indicate vascularization in the midsubstance (blue arrows), as well as in regions between the patellar tendon and surrounding fat pads (yellow arrows) (C) Quantification of cell density and total cell number using toluidine blue-stained sections of patellar tendons (n = 3, *p < 0.05). (D) BrdU staining of patellar tendons from WT and Scx-Cre; Tsc1 f/f littermates at P30. Scale bars indicate 50 μm.

