Fig. 5.
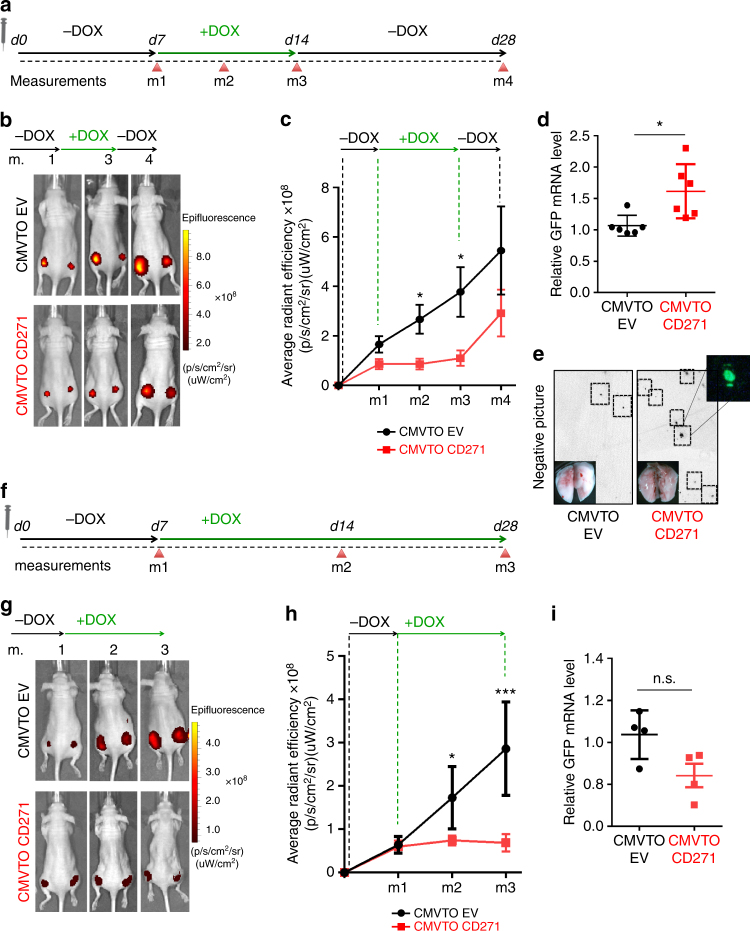
Transient CD271 overexpression in vivo increases metastasis. a Time course for the transient CD271 expression experiment in vivo. At day 0 (d0) the mice were injected with melanoma cells carrying CMVTOEV or CMVTOCD271 vectors. 1 week after injection (d7), the mice were treated with 200 ng/ml of doxycycline for 1 week until day 14 (d14). The mice were then released from doxycycline and analyzed 2 weeks later (d28). Different measurements (m1, m2, m3, m4) were done by IVIS to check tumor growth at different time points. b In vivo imaging of Nude mice injected with cells carrying CMVTOEV or CMVTOCD271 vectors. m1 = start of doxycycline treatment; m2 = during doxycycline treatment; m3 = end of doxycycline treatment; m4 = 2 weeks after release of doxycycline. c Quantification of the IVIS signal for infrared protein (iRFP) (4 mice for a total of 8 injections were analyzed for both conditions; P value_m1 > 0.05, P value_m2 ≤ 0.05, P value_m3 ≤ 0.05, P value_m4 > 0.05). Error bars indicate S.E.M. d qRT-PCR for GFP transcripts in lung lysates of Nude mice treated according to a (n = 6 for each condition. P value ≤ 0.05). Error bars indicate S.E.M. e Representative pictures of lungs at the end of the experiments to detect GFP. To enhance the visibility of the GFP spots, the pictures were set to grayscale and inverted. f Time course for the control experiment, in which CD271 expression was not switched. The experiment was designed as in a with the exception that between day 7 (d7) and day 28 (d28) the mice were not released from doxycycline but continuously treated. g In vivo imaging of Nude mice injected with cells carrying CMVTOEV or CMVTOCD271 vectors at different time points of the experiment (m1 = Start of doxycycline treatment; m2 = During doxycycline treatment; m3 = During doxycycline treatment). h Quantification of the IVIS signal for iRFP (4 mice for a total of 8 injections were analyzed for both conditions; P value_m1 > 0.05, P value_m2 ≤ 0.05, P value_m3 ≤ 0.001). Error bars indicate S.E.M. i qRT-PCR for GFP transcripts on lung lysates of Nude mice treated according to f. (n = 4 for each condition P value > 0.05). Error bars indicate S.E.M. All experiments done with cell line M010817

