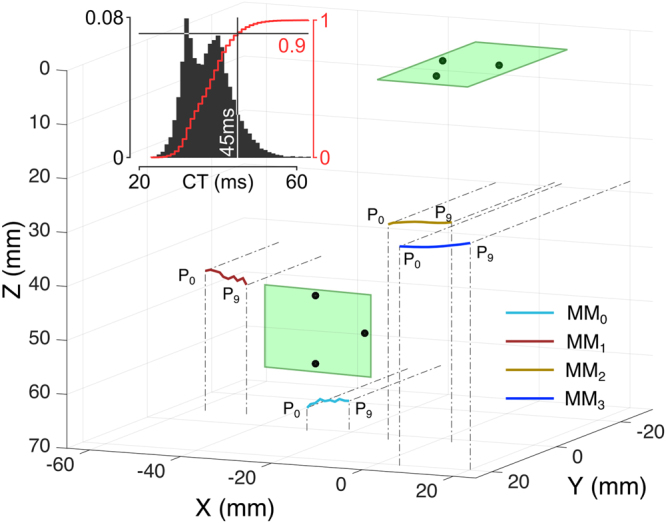
Figure 6.

Online performance of the myokinetic control interface. Three-dimension representation of the trajectories of the four MMs reconstructed by the localizer. The system was able to track all MMs along their ROM. Magnets were never confused with each other. The relative position of the two PCBs with the magnetic field sensors are represented as green rectangles and black dots, respectively. The inset shows the distribution of the computation time (CT) i.e., the time required to compute the positions of four MMs resolving the inverse magnetic problem (Equation 2) using the Levenberg-Marquardt optimization method on the PC (Intel i7-6700 CPU running at 3.4 GHz, 16 GB of RAM, Windows 7). The red curve represents the cumulative distribution.
