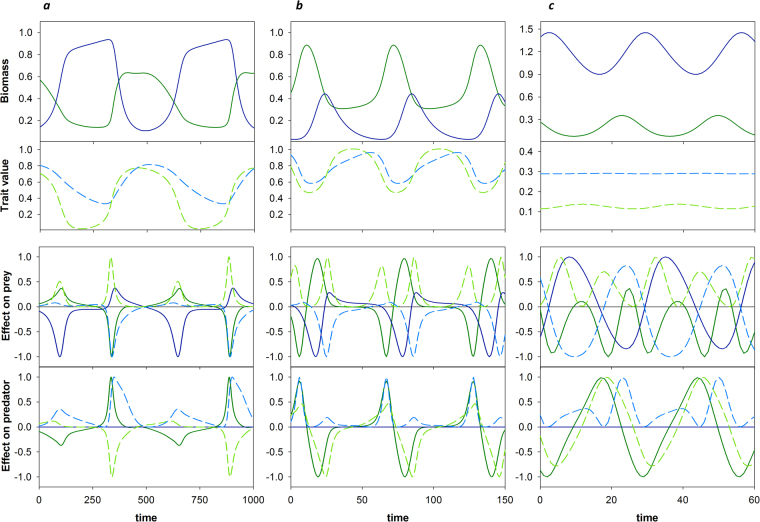
Figure 1.
Eco-evolutionary dynamics and dynamics of components resulting from Geber method decomposition. Top row: prey (solid green) and predator (solid blue) dynamics. Second row: defense (dashed green) and offense (dashed blue) dynamics. Third row: how the change in the prey growth rate (W x) is affected by changes in prey biomass (E x (x), solid green), predator biomass (E y (x), solid blue), defense (E u (x), dashed green) and offense (E v (x), dashed blue). Bottom row: how the change in the predator growth rate (W y) is affected by the changes in prey biomass (E x (y)), predator biomass (E y (y)), defense (E u (y)) and offense (E v (y)). (a) Example of antiphase cycles, standard parameters for speed analysis (see Table 1) with G x = G y = 10−2. (b) ¼-lag cycles caused by rapid predator adaptation, standard parameters for speed analysis with G x 10−1, G y = 10−0.9. (c) ¼-lag cycles caused by high cost of defense, standard parameters for cost analysis with c x = 5, h = 2. Time is measured in time steps after the first 30,000 time steps of the simulation. Component effects are standardized with respect to their absolute maxima over time, so the range is between −1 and 1.

